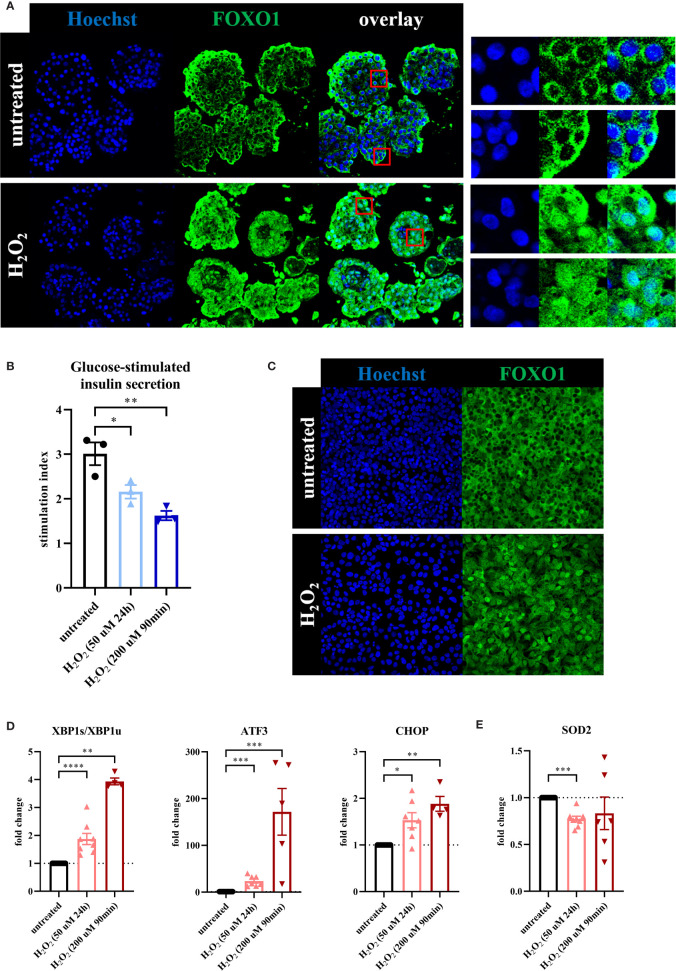
Figure 1.
Oxidative stress leads to loss of β-cell function associated with a β-cell stress response. To evaluate the effect of oxidative stress on β-cell function and stress response, primary human islets (blue graphs) or EndoC-βH1 cells (red graphs) were treated with hydrogen peroxide (H2O2). (A) Treatment of human islets with 100 μM H2O2 for 90 minutes, assessed after 72 hours, leads to shuttling of the transcription factor FOXO1 from its normal cytoplasmic localization to the nucleus, as seen in the magnifications in the panels on the right. Nuclear FOXO1 translocation (as assessed by the overlap of FOXO1 and Hoechst staining) occurred in 94% of cells after H2O2 treatment, compared to 5% of cells in the untreated condition. (B) H2O2-induced oxidative stress in human islets leads to decreased glucose-stimulated insulin secretion. GSIS was performed 24 hours after the start of the 90min 200 μM H2O2 treatment or immediately after the 24h 50 μM H2O2 treatment. (C) Daily treatment of EndoC-βH1 cells with 100 μM H2O2 for 90 minutes, assessed after 72 hours, leads to shuttling of the transcription factor FOXO1 from its normal cytoplasmic localization to the nucleus. (D) Oxidative stress induction in EndoC-βH1 cells by treatment with 50 μM H2O2 for 24 hours and 200 μM H2O2 for 90 minutes leads to increased mRNA expression levels of the unfolded protein response-related genes XBP1s/XBP1u, ATF3 and CHOP as measured by qPCR. (E) Oxidative stress induction in EndoC-βH1 cells by treatment with 50 μM H2O2 for 24 hours leads to a decreased mRNA expression level of the mitochondrial enzyme SOD2 as measured by qPCR. Data are presented as means ± SEM of fold change over untreated control islets (blue graphs) or EndoC-βH1 cells (red graphs). n = 3-8 donors/batches; each data point represents one donor/batch. *p < 0.05, **p < 0.01, ***p < 0.0005, ****p < 0.0001 vs. untreated control islets/EndoC-βH1 cells as determined by an unpaired Student’s t test on the stimulation indices (for the glucose-stimulated insulin secretion data) or a paired Student’s t test on the dCT values (for the qPCR data). Black circles = untreated control islets/EndoC-βH1 cells, upward-pointing triangles = H2O2-treated islets/EndoC-βH1 cells (50 μM 24h), downward-pointing triangles = H2O2-treated islets/EndoC-βH1 cells (200 μM 90min). h = hours, min = minutes, H2O2 = hydrogen peroxide.

