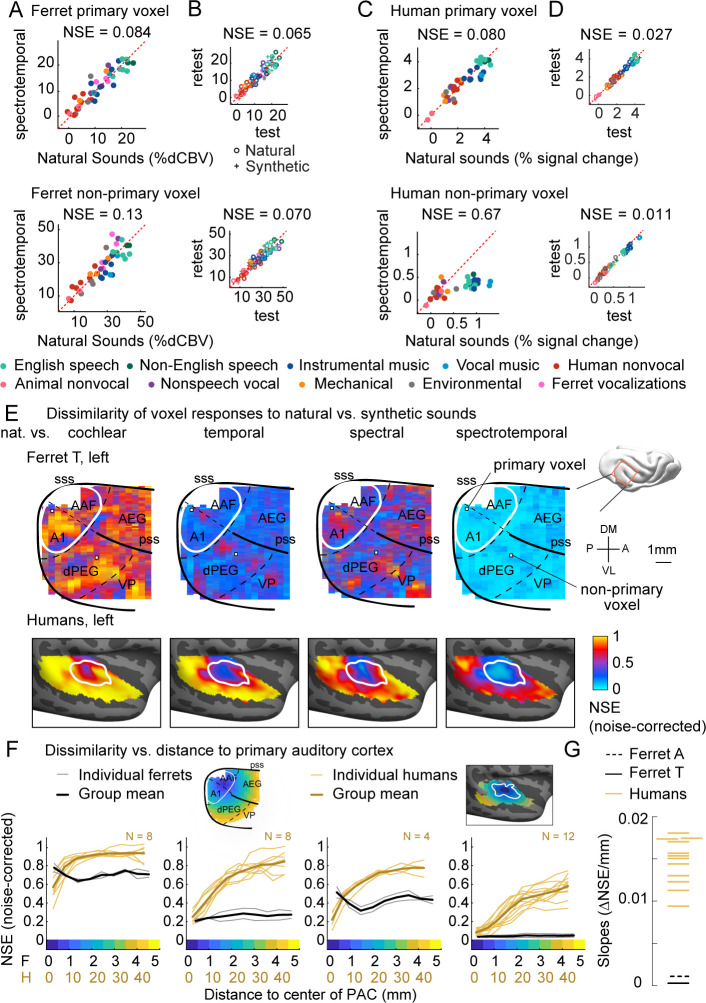
Figure 2. Dissimilarity of responses to natural vs. synthetic sounds in ferrets and humans.
(A) Response of two example fUS voxels to natural and corresponding synthetic sounds with matched spectrotemporal modulation statistics. Each dot shows the time-averaged response to a single pair of natural/synthetic sounds (after denoising), with colors indicating the sound category. The example voxels come from primary (top, A1) and non-primary (bottom, dPEG) regions of the ferret auditory cortex (locations shown in panel E). The normalized squared error (NSE) quantifies the dissimilarity of responses. (B) Test–retest response of the example voxels across all natural (o) and synthetic (+) sounds (odd vs. even repetitions). The responses were highly reliable due to the denoising procedure. (C, D) Same as panels (A, B), but showing two example voxels from human primary/non-primary auditory cortex. (E) Maps plotting the dissimilarity of responses to natural vs. synthetic sounds from one ferret hemisphere (top row) and from humans (bottom row). Each column shows results for a different set of synthetic sounds. The synthetic sounds were constrained by statistics of increasing complexity (from left to right): just cochlear statistics, cochlear + temporal modulation statistics, cochlear + spectral modulation statistics, and cochlear + spectrotemporal modulation statistics. Dissimilarity was quantified using the NSE, corrected for noise using the test–retest reliability of the voxel responses. Ferret maps show a ‘surface’ view from above of the sylvian gyri, similar to the map in humans. Surface views were computed by averaging activity perpendicular to the cortical surface. The border between primary and non-primary auditory cortex is shown with a white line in both species and was defined using tonotopic gradients. Areal boundaries in the ferret are also shown (dashed thin lines). This panel shows results from one hemisphere of one animal (ferret T, left hemisphere), but results were similar in other animals/hemispheres (Figure 2—figure supplement 2). The human map is a group map averaged across 12 subjects, but results were similar in individual subjects (Norman-Haignere et al., 2018). (F) Voxels were binned based on their distance to primary auditory cortex (defined tonotopically). This figure plots the median NSE value in each bin. Each thin line corresponds to a single ferret (gray) or a single human subject (gold). Thick lines show the average across all subjects. The ferret and human data were rescaled so that they could be plotted on the same figure, using a scaling factor of 10, which roughly corresponds to the difference in the radius of primary auditory cortex between ferrets and humans. The corresponding unit is plotted on the x-axis below. The number of human subjects varied by condition (see Materials and methods for details) and is indicated on each plot. (G) The slope of NSE vs. distance-to-primary auditory cortex (PAC) curve (F) from individual ferret and human subjects using responses to the spectrotemporally matched synthetic sounds. We used absolute distances to quantify the slope, which is conservative with respect to the hypothesis since correcting for brain size would differentially increase the ferret slopes.
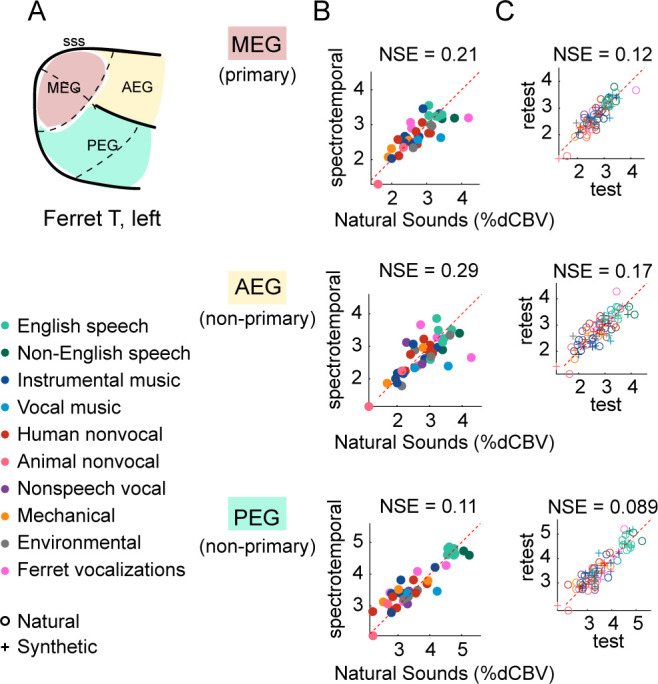
Figure 2—figure supplement 1. Responses to natural and synthetic sounds in standard anatomical regions of interest (ROIs).

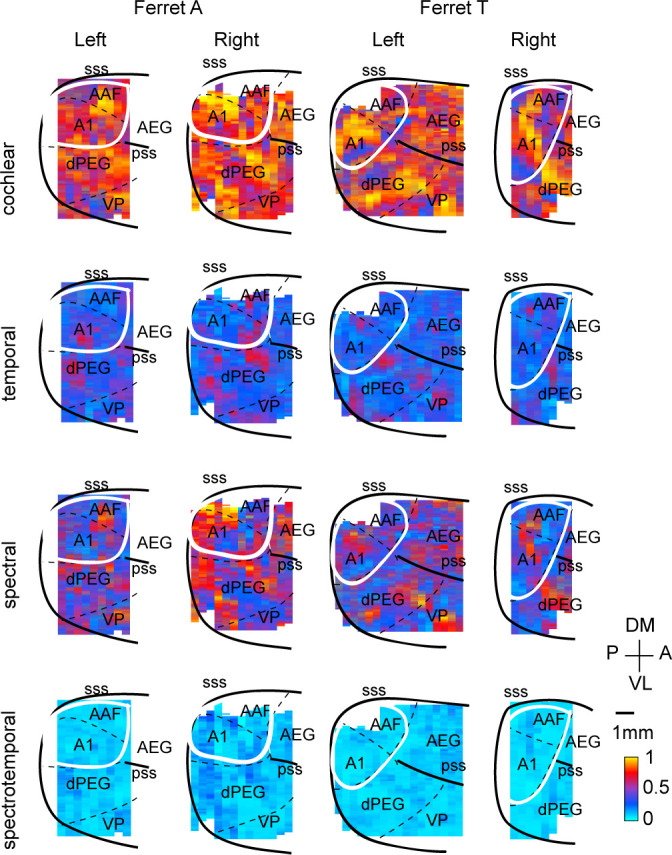
Figure 2—figure supplement 2. Dissimilarity maps for all hemispheres and animals.

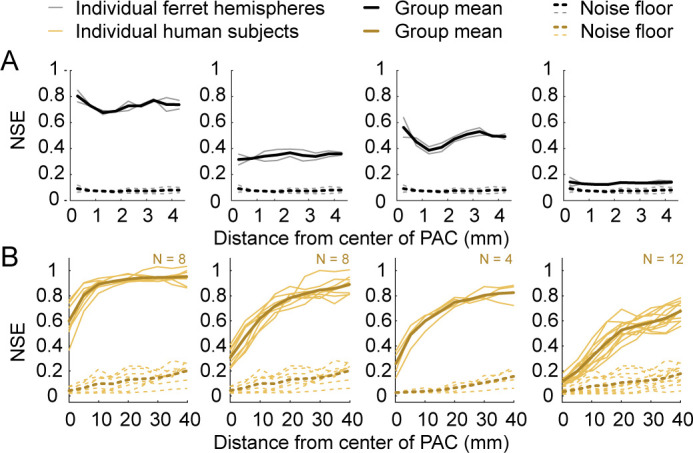
Figure 2—figure supplement 3. Uncorrected normalized squared error (NSE) values.


