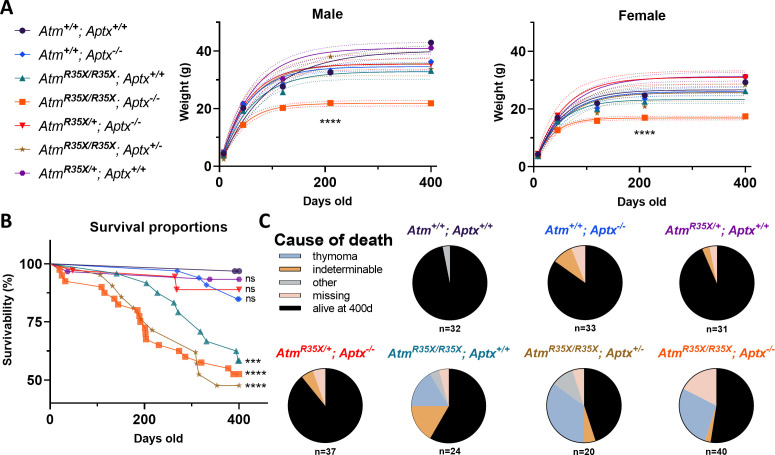
Figure 2. Health and survivability of single and double mutant mice.
(A) Left: The line color and symbol for each genotype are denoted and are consistent across all figures. Right: AtmR35X/R35X; Aptx−/− mice weighed significantly less than all control genotypes as indicated by the growth curves (±95% confidence interval; dotted lines). Growth curve (AtmR35X/R35X; Aptx−/− vs. controls): Male k=0.024 vs 0.011−0.019, Ymax=21.8 vs. 32.9−41.0 g (n=3–18); Female k=0.030 vs. 0.017–0.022, Ymax=16.9 vs 23.3–31.3 (n=2–19). Sum of squares F-test run across all curves: Male F(12, 364)=30.5, p<0.0001, Female F(12, 339)=28.3, p<0.0001. (B) ATM-deficient mice, regardless of APTX expression, displayed significantly lower survivability with ~55% of mice deceased by P400. No statistical differences between ATM-deficient mice were detected. Moreover, a single wild-type copy of the Atm gene was sufficient to prevent premature death (no statistical difference detected between AtmR35X/+; Aptx−/− and Atm+/+; Aptx+/+ mice). Log-rank (Mantel-Cox) tests across all (χ2(6,217)=48.4, p<0.0001), just the ATM-deficient (χ2(2,217)=1.06, p=0.6), and single comparisons to wild-type (see figure) were conducted. Total number of animals indicated in panel (C). (C) Pie charts illustrating that ATM-deficient mice displayed a high prevalence of thymomas based on postmortem necropsies. ‘Other’ probable causes of death included enlarged livers and obstructed kidneys. ‘Missing’ mice were presumed dead and cannibalized by cage mates, cause of death unknown. ATM, Ataxia Telangiectasia mutated.


