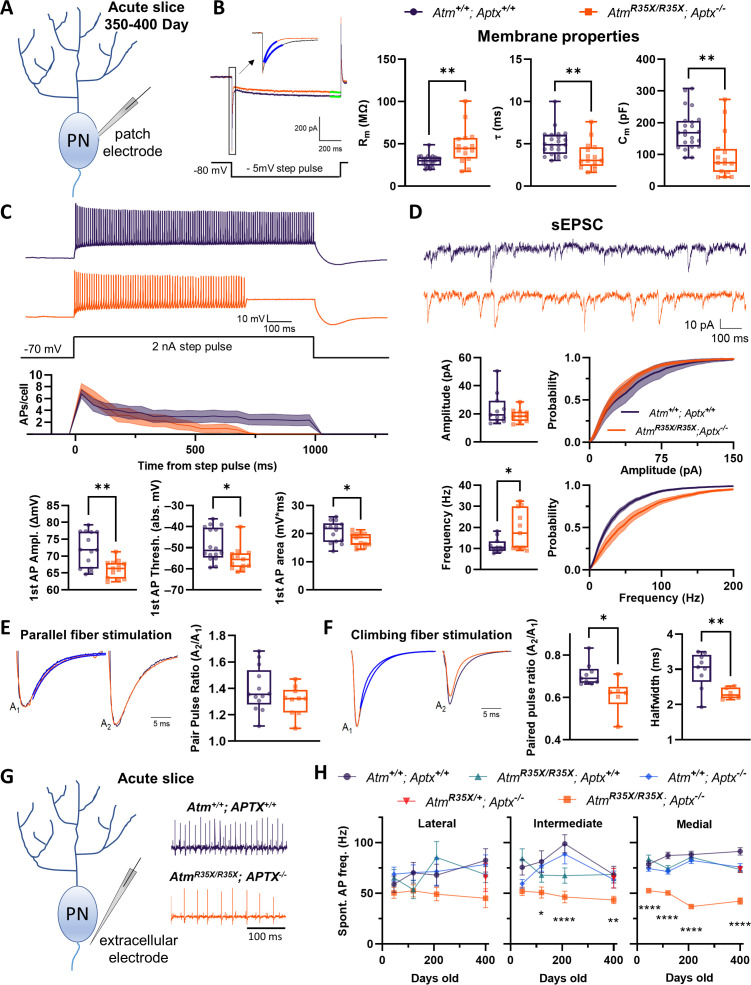
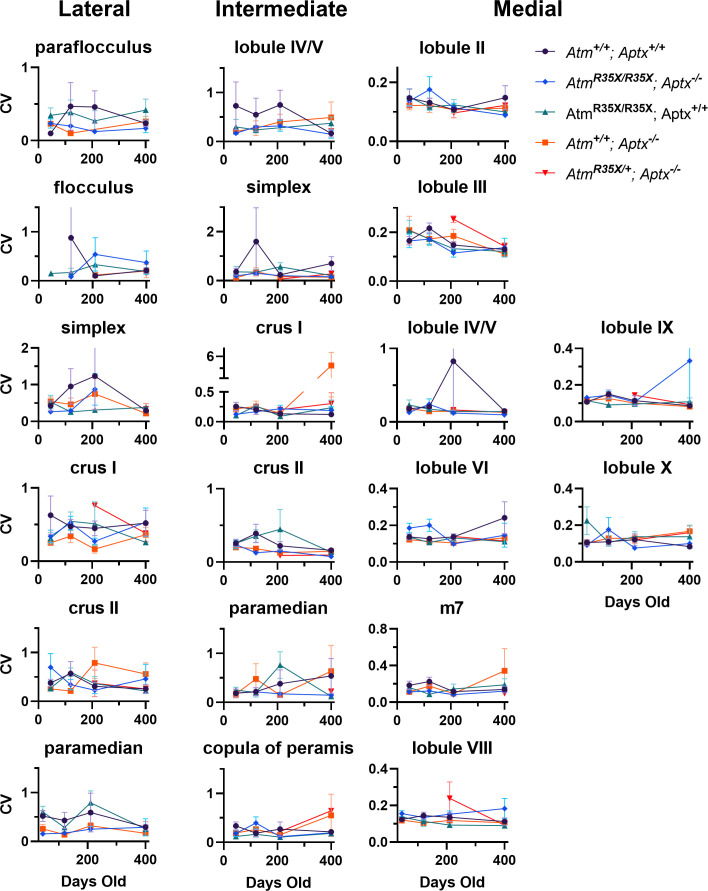
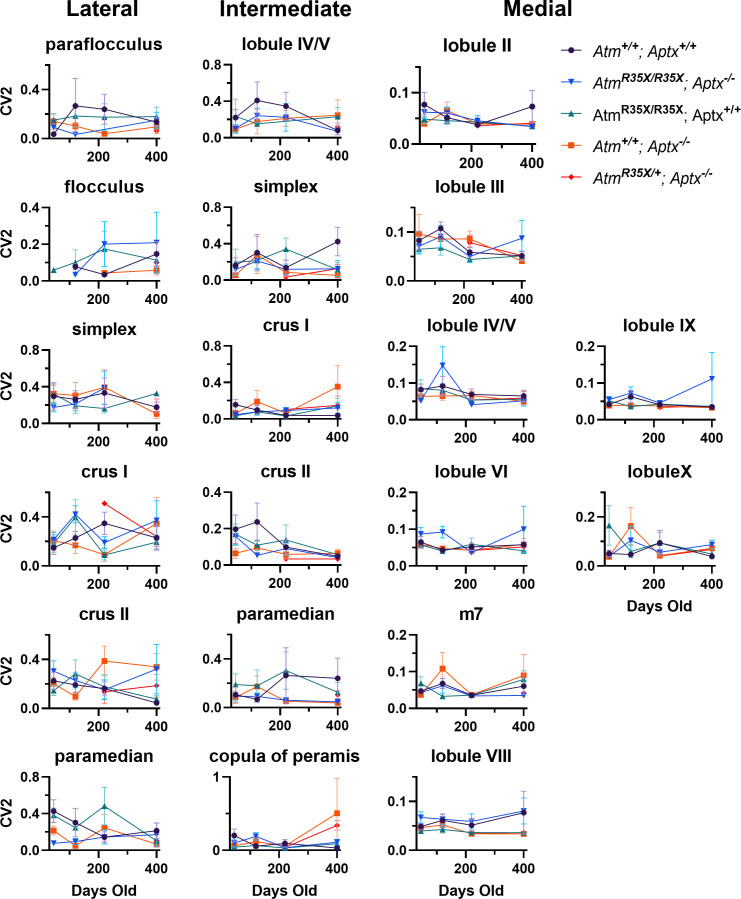
Figure 4. The biophysical properties of PNs are significantly perturbed in AtmR35X/R35X; Aptx−/− mice.
(A) Schematic diagram of intracellular recording from a single Purkinje neuron (PN) in an acute cerebellar tissue slice preparation used to examine their physiological properties. (B) Left: Voltage-clamp measurements of PN membrane properties made from a 1 s, –5 mV step pulse as illustrated. Right: The membrane input resistance (Rm), time constant (τ), and capacitance (Cm) were perturbed in AtmR35X/R35X; Aptx−/− compared to Atm+/+; Aptx+/+ mice. (C) Current-clamp recordings of PN action potentials (APs) after 2 nA step pulses from a –70 mV holding potential. PN APs recorded from AtmR35X/R35X; Aptx−/− fail to maintain constant firing and summary plots show that they have lower 1st AP amplitudes, firing threshold, and area under the curve. (D) Top: Example sEPSC traces taken from a PN under voltage clamp at a –80 mV holding potential. Bottom: Median frequency and amplitude data, along with the overall probability distribution function are plotted for both Atm+/+; Aptx+/+ (n=11) and AtmR35X/R35X; Aptx−/− (n=11) mice. The frequency but not amplitude of PNs recorded in AtmR35X/R35X; Aptx−/− mice was found to be perturbed. (E, F) Left: Example traces of evoked EPSCs recorded from PNs as a result of a two-pulse stimulation (50 ms interval) of either parallel (E) or climbing (F) fiber axons. Traces illustrate the first (A1) and second (A2) amplitude (normalized) and time course of decay (blue fitted line) of each synaptic response. Right: Summary plots of the paired-pulse ratio. While parallel fiber paired-pulse facilitation was normal in AtmR35X/R35X; Aptx−/− mice, climbing fiber paired-pulse depression and halfwidth was significantly perturbed compared to Atm+/+; Aptx+/+ mice. (G) Schematic diagram of extracellular recording from a single PN in an acute cerebellar tissue slice preparation. Example electrophysiological traces for Atm+/+; Aptx+/+ (purple, top) and AtmR35X/R35X; Aptx−/− (orange, bottom) PNs in the medial area (i.e., vermis) of the cerebellum. (H) AtmR35X/R35X; Aptx−/− PN AP firing frequency progressively decreased with age and was significantly slower in comparison to all control genotypes expressing at least one copy of the Atm or Aptx gene [Atm+/+; Aptx+/+ (n=52–59), Atm+/+; Aptx−/− (n=51–64), AtmR35X/R35X; Aptx+/+ (n=39–52), AtmR35X/R35X; Aptx−/− (n=24–71), AtmR35X/+; Aptx−/− (n=69)]. Data in (B) were compared using an ANOVA (Kruskal-Wallis) followed by Dunn’s multiple comparisons test, data in (D–F) were compared via Welch’s t-test, and data in (H) using a two-way ANOVA followed by Holm-Šídák’s multiple comparisons test. Symbol/color key: Atm+/+; Aptx+/+ (purple circle), Atm+/+; Aptx−/− (blue diamond), AtmR35X/R35X; Aptx+/+ (green triangle), AtmR35X/R35X; Aptx−/− (orange square), AtmR35X/+; Aptx−/− (red inverted triangle). sEPSC, spontaneous excitatory postsynaptic current.

