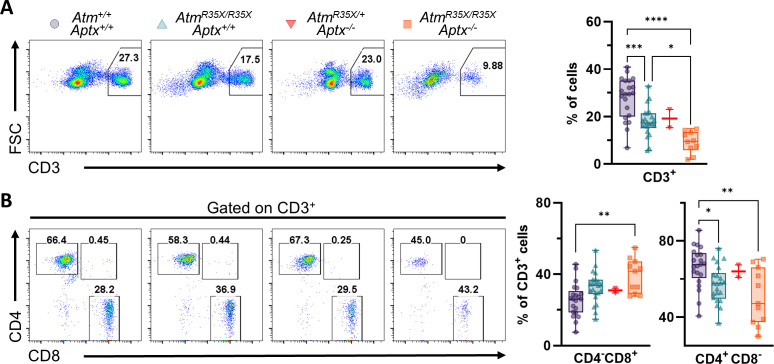
Figure 6. T-cell deficits are found in the blood of AtmR35X/R35X; Aptx−/− mice.
(A) Representative flow cytometric profiles of T-cell glycoprotein marker CD3 and summary plots indicate ATM- and/or APTX-deficient mice have decreased proportions of CD3+ T-cells in the blood. (B) Representative flow cytometric profiles of T-cell glycoprotein markers CD4 and CD8 gated on CD3+ cells and summary plots for CD8 and CD4 single positive cell proportions. ATM-deficient mice had reduced CD4+ proportions compared to mice with at least one copy of the Atm gene. Statistical significances were assessed via one-way ANOVA followed by Tukey’s pairwise multiple comparisons test. Number of animals denoted at bottom of bar. Symbol/color key: Atm+/+; Aptx+/+ (purple circle), AtmR35X/R35X; Aptx+/+ (green triangle), AtmR35X/+; Aptx−/− (red inverted triangle), AtmR35X/R35X; Aptx−/− (orange square). ATM, Ataxia Telangiectasia mutated.

