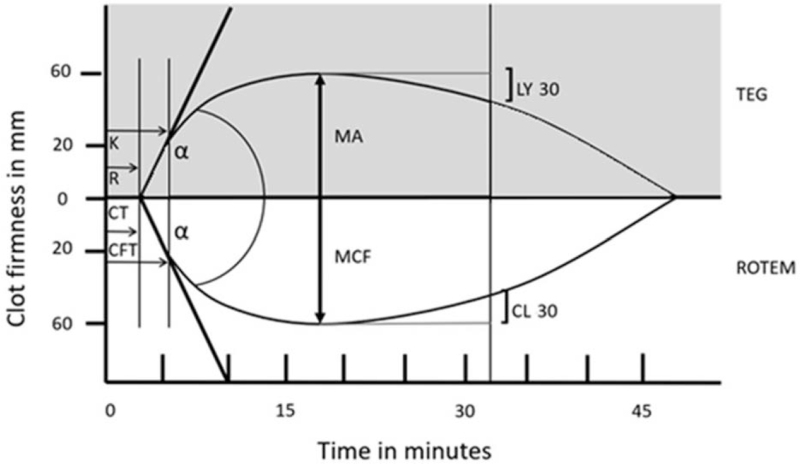
Fig. 2.
Comparison of TEG and ROTEM tracings to demonstrate their similarities. TEG indicates thrombelastography; ROTEM, rotational thromboelastometry; R, reaction time; CT, clotting time; k, k-time or kinetics; CFT, clot formation time; α, alpha-angle; MA, maximum amplitude; MCF, maximum clot firmness; LY30, lysis at 30 min; CL30, clot lysis at 30 min.

