. 2021 Sep 29;10:e66609. doi: 10.7554/eLife.66609

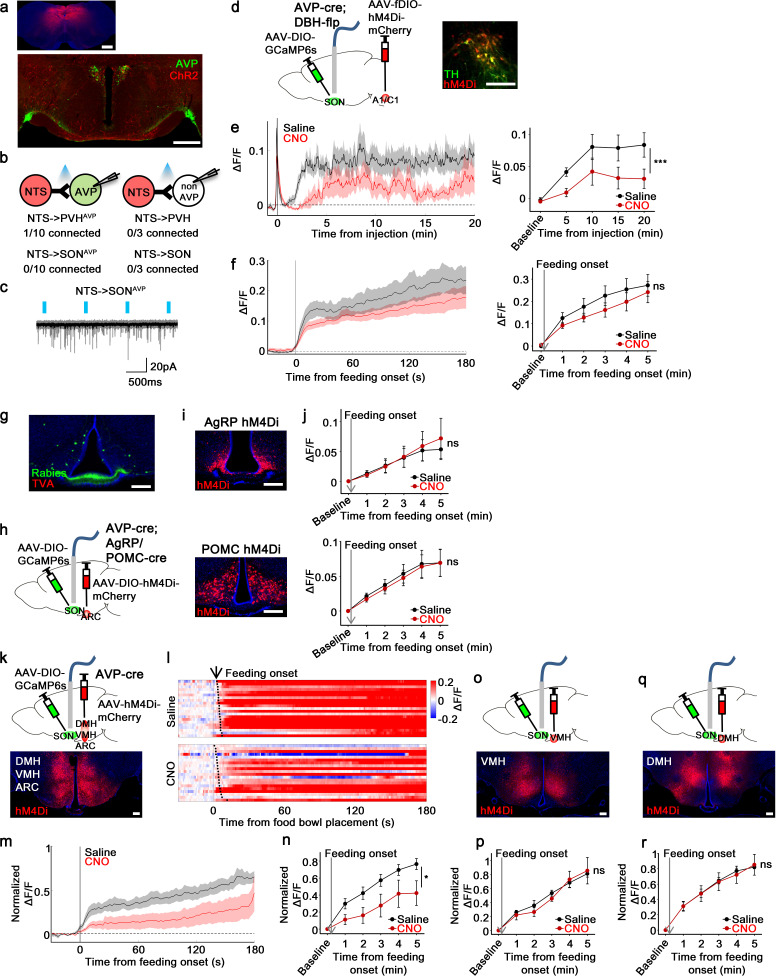
Figure 7. non-AgRP/POMC neurons in the ARC mediate food-related presystemic regulation of SONAVP neurons.

(a) Representative images showing expression of ChR2-mCherry in the NTS (top), and their efferent projections in the PVH and SON (bottom). (b) Number of PVHAVP and SONAVP neurons (left), and non-GFP PVH and SON neurons (right) receiving direct synaptic inputs from the NTS. (c) Representative traces showing light-evoked responses. Black trace is an average of all traces (gray) in consecutive trials. (d) Schematic of SONAVP photometry experiment with hM4Di-mediated inhibition of A1/C1 neurons. (e) Average SONAVP population activity to hypotension induced by vasodilating drug HDZ in saline and CNO trials (left). Data binned every 5 min (right). ***p<0.001; RM two-way ANOVA, p<0.001, n=9 mice. (f) Average SONAVP population activity in response to feeding onset in saline and CNO trials (left). Data binned across feeding periods (right). ns, p>0.05; RM two-way ANOVA, p>0.05, n=16 mice. (g) Representative image showing rabies-labeled neurons in the ARC that are monosynaptically connected to magnocellular SONAVP neurons. (h) Schematic of SONAVP photometry experiment with hM4Di-mediated inhibition of AgRP or POMC neurons. (i) Representative images showing hM4Di expression in AgRP (top) and POMC neurons (bottom). (j) Average SONAVP population activity binned across feeding periods in saline and CNO trials of AVP-IRES-Cre;Agrp-IRES-Cre (top) and AVP-IRES-Cre;Pomc-IRES-Cre (bottom) mice. ns, p>0.05; RM two-way ANOVA, p>0.05 (AgRP), p>0.05 (POMC), n=4 (AgRP), 8 (POMC). (k, o, q) Schematic of SONAVP photometry experiment with hM4Di-mediated non-specific inhibition of the ARC+VMH+DMH (k), VMH only (o), and DMH only (q). (l) Single-trial timecourses of SONAVP population activity in response to food bowl placement in saline and CNO trials of ARC+VMH+DMH group. Trials are sorted according to latency from food bowl placement to feeding onset (black ticks). n=5 mice. (m) Average SONAVP population activity in response to feeding onset in saline and CNO trials of ARC+VMH+DMH group. n=9 mice. (n, p, r) Average SONAVP population activity binned across feeding periods in saline and CNO trials of ARC+VMH+DMH (n), VMH only (p), and DMH only (r) groups. ns, p>0.05; *p<0.05; RM two-way ANOVA, p=0.033 (ARC+VMH+DMH), p>0.05 (VMH only), p>0.05 (DMH only), n=5 (ARC+VMH+DMH), 4 (VMH only), 7 (DMH only) mice. Scale bars, 500 µm (a, d), 200 µm (g, i, k, o, q). Values are means ± SEMs across mice. See also Figure 7—figure supplements 14. AVP, vasopressin; DMH, dorsomedial nuclei; SON, supraoptic nuclei; VMH, ventromedial.

Figure 7—source data 1. SONAVP neuron response to food bowl placement after inhibition of AgRP and POMC neurons, ARC, DMH, and VMH.

Figure 7.

Figure 7—figure supplement 1. The NTS does not provide input to AVP neurons.

Figure 7—figure supplement 1.

(a, b) Representative images showing expression of ChR2-mCherry in A2, NTSVglut2 neurons (a), and their efferent projections in the PVH and SON (b). (c, d) Number of PVHAVP and SONAVP neurons (c), and non-GFP PVH and SON neurons (d) receiving direct synaptic inputs from A2, NTSVglut2 neurons as identified by CRACM. Mice used include AVP-GFP;TH-IRES-Cre (A2) and AVP-GFP;Vglut2-IRES-Cre (NTSVglut2). (e) Representative traces showing light-evoked responses in A2 to SONAVP (top) and NTSVglut2 to SONAVP (bottom) CRACM. Black trace is an average of all traces (gray) in consecutive trials. AVP, vasopressin; CRACM, channelrhodopsin (ChR2)-assisted circuit mapping; PVH, paraventricular; SON, supraoptic nuclei.
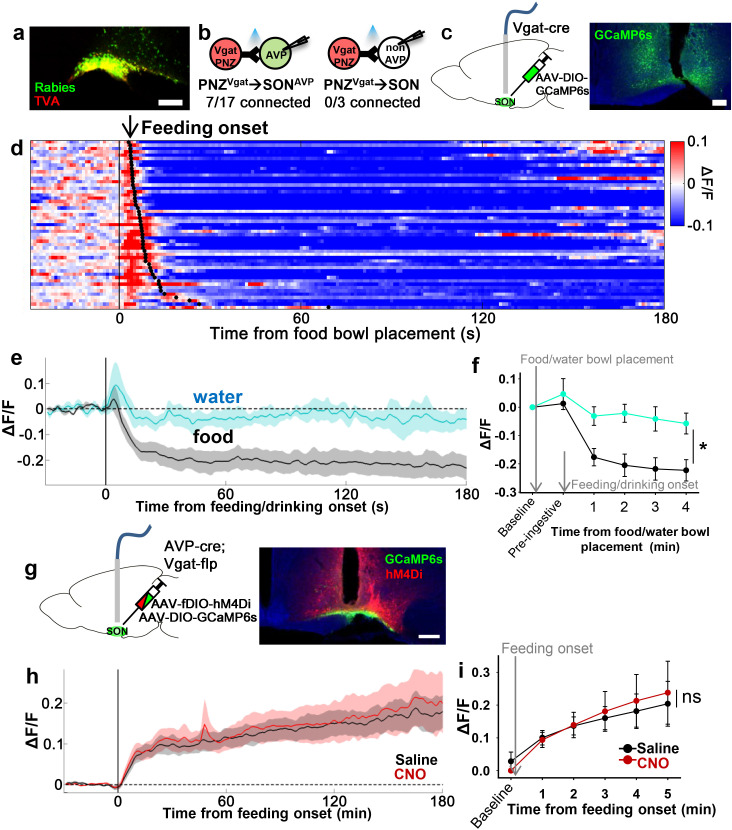
Figure 7—figure supplement 2. PNZGABA neurons show presystemic responses to feeding but are not required for food-related presystemic regulation of SONAVP neurons.

Figure 7—figure supplement 2.

(a) Representative image showing rabies-labeled neurons in the PNZ that are monosynaptically connected to magnocellular SONAVP neurons. (b) Number of SONAVP neurons (left) and non-GFP SON neurons (right) receiving direct synaptic inputs from PNZGABA neurons as identified by CRACM in AVP-GFP;Vgat-IRES-Cre. (c) Schematic of PNZGABA photometry experiment. (d) Heatmap showing single-trial timecourses of PNZGABA population activity in response to food bowl placement. Trials are sorted according to latency from food bowl placement to feeding onset (black ticks). n=8 mice. (e) Average PNZGABA population activity in response to water/food bowl placement. n=3 mice. (f) Average PNZGABA population activity binned across drinking/feeding periods. *p<0.05; two-way ANOVA, p=0.03, n=3 mice. (g) Schematic of SONAVP photometry experiment with hM4Di-mediated inhibition of PNZGABA neurons. (h) Average of SONAVP population activity in response to feeding onset in saline and CNO trials. n=6 mice. (i) Average SONAVP population activity binned across feeding periods in saline and CNO trials. ns, p>0.05; two-way ANOVA, p>0.05, n=6 mice. Scale bar, 200 µm. Values are means ± SEMs. AVP, vasopressin; CRACM, channelrhodopsin (ChR2)-assisted circuit mapping; PNZ, perinuclear zone; SON, supraoptic nuclei.
Figure 7—figure supplement 2—source data 1. PNZGABA neurons show presystemic responses to feeding but are not required for food-related presystemic regulation of SONAVP neurons.
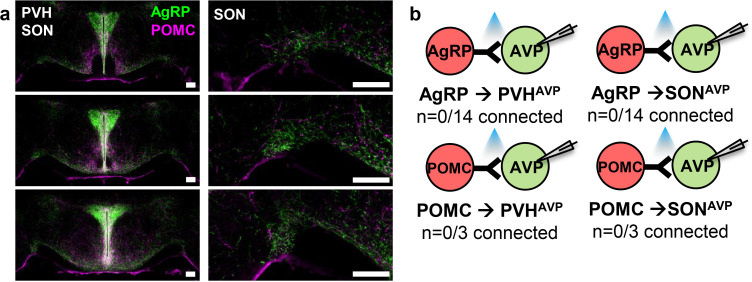
Figure 7—figure supplement 3. PVHAVP and SONAVP neurons do not receive direct synaptic inputs from AgRP and POMC neurons.

Figure 7—figure supplement 3.

(a) Projections of AgRP and POMC neurons in the PVH and SON identified by immunostaining (left). Magnified view of the SON showing presence of AgRP and POMC fibers (right). (b) Lack of direct synaptic connections between AgRP neurons and PVHAVP and SONAVP neurons as identified by CRACM in AVP-GFP;Agrp-IRES-Cre. Scale bar, 200 µm. AVP, vasopressin; CRACM, channelrhodopsin (ChR2)-assisted circuit mapping; PVH, paraventricular; SON, supraoptic nuclei.
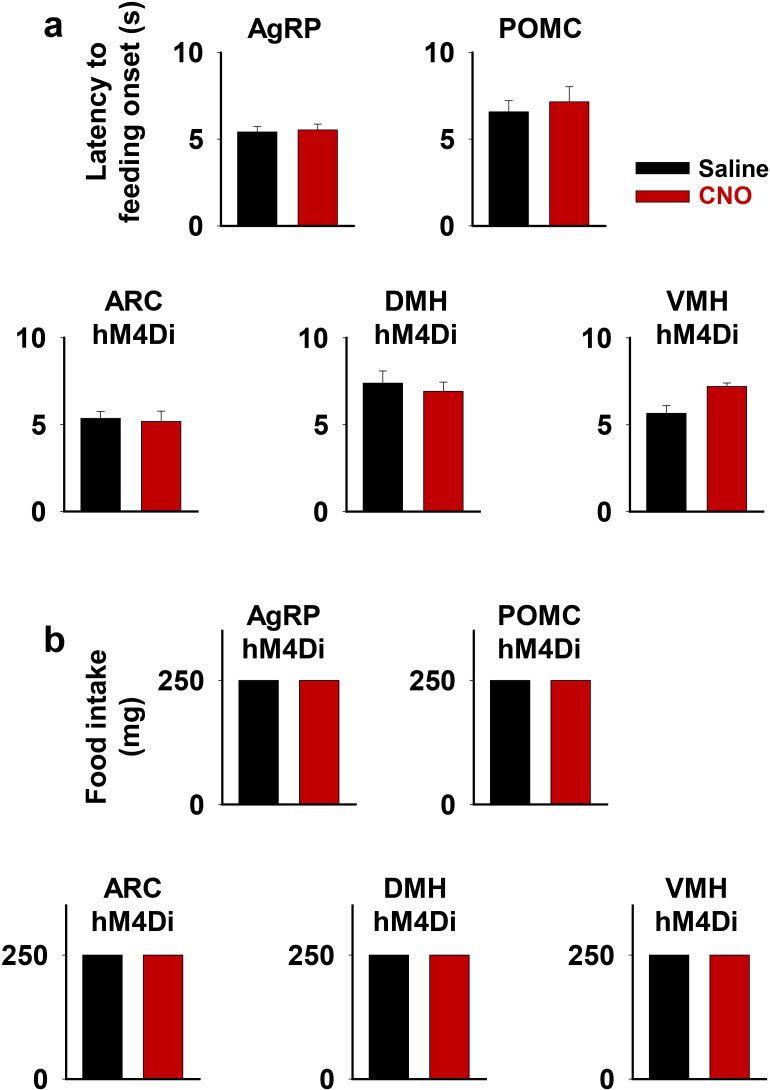
Figure 7—figure supplement 4. Inhibition of the ARC, DMH, or VMH does not affect short-term feeding behavior.

Figure 7—figure supplement 4.

Latency to feeding onset (a) and amount of food intake during the first 5 min of experiment (b) in saline and CNO trials of fiber photometry experiments in Figure 7. One 250 mg pellet was provided in all trials. DMH, dorsomedial nuclei; VMH, ventromedial.
Figure 7—figure supplement 4—source data 1. Inhibition of the ARC, DMH, or VMH does not affect short-term feeding behavior.