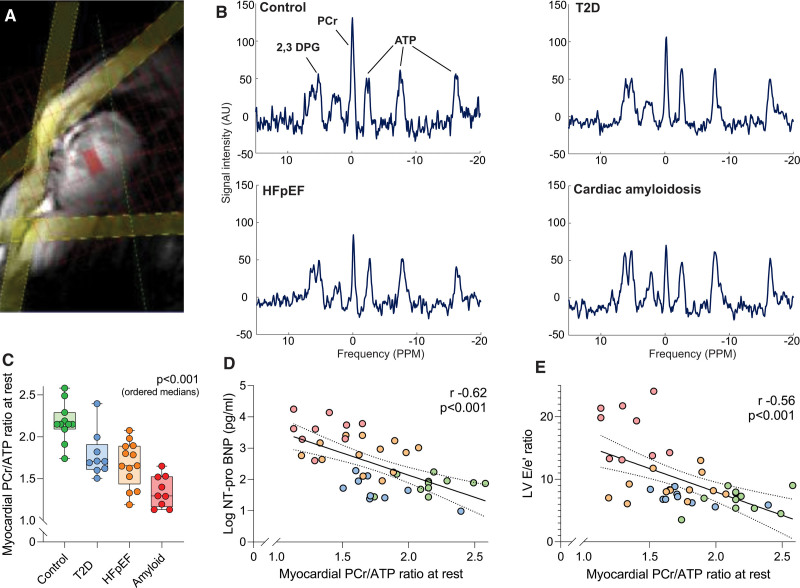
Figure 2.
Cardiac energetics across the spectrum of diastolic dysfunction. A, Phosphorus magnetic resonance spectroscopy acquisition strategy with a voxel placed in the midventricular septum (red) and saturation bands (yellow) placed over skeletal muscle and the liver. B, Representative cardiac 31P spectra for the different study groups showing (C) progressive depletion of phosphocreatine (PCr)/ATP and associations with (D) NT-proBNP (N-terminal pro-brain natriuretic peptide) and (E) left ventricular (LV) E/e′ ratio. P values (ordered medians) reported are the result of Jonckheere-Terpstra test across the groups or from linear regression analysis. DPG indicates diphosphoglycerate; and T2D, type 2 diabetes.

