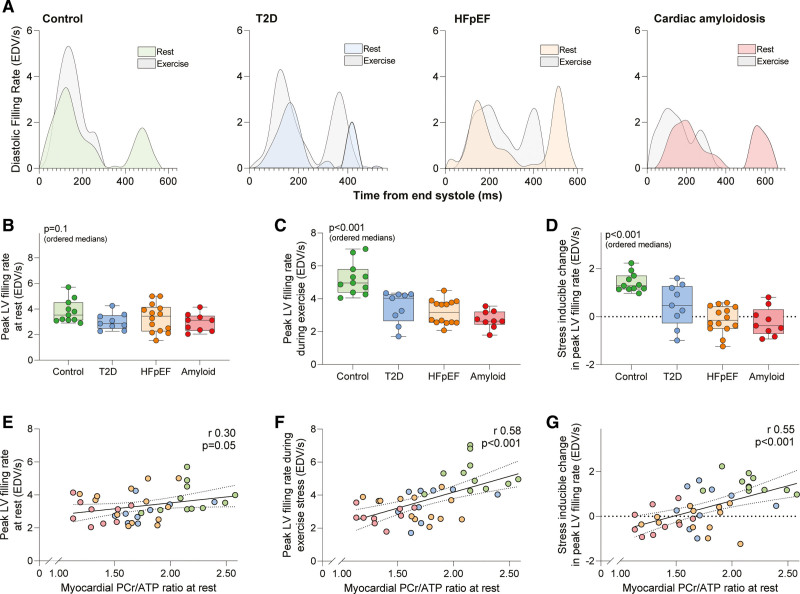
Figure 4.
Cardiac energetics and diastolic filling at rest and during exercise. A, Representative examples of volume–time curves for the study groups. Second row: (B) peak left ventricular (LV) diastolic filling rates at rest, (C) peak LV diastolic filling rates during exercise, and (D) the stress-inducible change in peak LV diastolic filling rates across the groups. Third row: relationship between cardiac energetics at rest and (E) peak LV diastolic filling rates at rest, (F) peak LV diastolic filling rates during exercise, and (G) the stress-inducible change in peak LV diastolic filling rates across the groups. P values (ordered medians) reported are the result of Jonckheere-Terpstra test across the groups or from linear regression analysis. EDV/s indicates end-diastolic volume (in milliliters) per second; HFpEF, heart failure with preserved ejection fraction; PCr, phosphocreatine; and T2D, type 2 diabetes.

