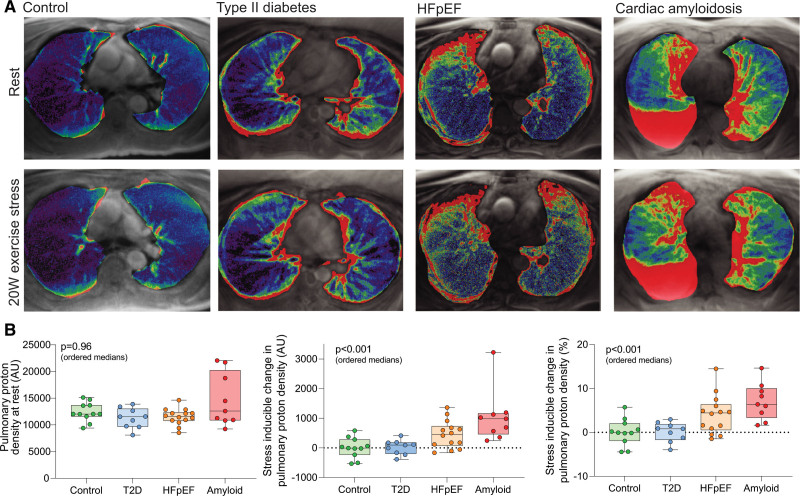
Figure 5.
Pulmonary congestion across the spectrum of diastolic dysfunction. A, Representative examples of lung water color maps for the study groups at rest and during low-intensity exercise stress. Look-up table details are provided in Figure S6. B, Resting pulmonary proton density (lung water) signal for the study groups along with absolute and percentage changes in pulmonary proton density during low-intensity exercise. The participant shown with cardiac amyloidosis has a right-sided pleural effusion. Pleural effusions (n=5) were seen only in the cardiac amyloidosis group and were pre hoc included in the region of interest. However, the magnitude and statistical significance of the stress-inducible change in lung water signal were essentially unchanged on a subsequent retrospective analysis in which pleural effusions were excluded from the region of interest. P values (ordered medians) reported are the result of Jonckheere-Terpstra test across the groups. HFpEF indicates heart failure with preserved ejection fraction; and T2D, type 2 diabetes.

