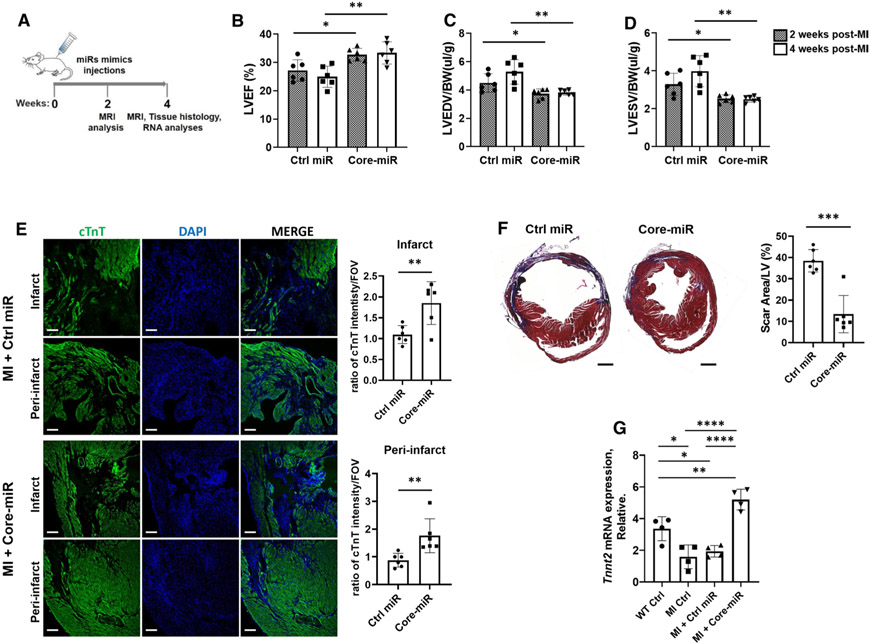
Fig. 3.
EV-derived-miR-106a–363 cluster enhances LV function and preserves chamber size in ischemia-injured heart. a In vivo study schematic. b–d LVEF, LV end-diastolic volume indexed to body weight (LVEDV), and LV end-systolic volume indexed to body weight (LVESV) measurements of Core-miR (miR-92a, −20b, and −363) vs. Control-miR-treated mice (n = 6) at weeks 2 and 4 post-MI. Statistical significance was determined by unpaired two-tailed t test and mean ± SD. e Measurements of cTnT (cardiomyocytes) expression in the infarct and peri-infarct region (PIR) of the ischemia-injured hearts. cTnT column: confocal microscopic images of the Ctrl-miR vs. Core-miR-injected groups demonstrated cTnT + cardiomyocytes labeled with green fluorescent protein. DAPI column: nucleus was labeled with DAPI (blue). MERGE column: cTnT + cardiomyocytes and DAPI nucleus were co-localized. The images captured eight random areas per each group. Quantitative graphs showed (right panel) the ratio of cTnT + intensity per area of the FOV (field of view). Scale bar: 100 μm. Error bars mean ± SD (Control-miR, n = 6; Core-miR, n = 6). f Trichrome-mason stain of ischemia-injured mouse heart tissue compared the extent of fibrosis in Control-miR and Core-miR injected hearts. A quantitative graph showed the percentage of scar area in the LV. Scale bar: 1 mm. Error bars mean ± SD (Control-miR, n = 6; Core-miR, n = 6). g Tnnt2 (cardiomyocyte) mRNA expression in murine myocardial tissue was measured by qRT-PCR after 4 weeks (day 28) post-MI in the following groups: (1) WT Ctrl: non-MI normal control; (2) MI Ctrl: 4 wks post-MI control; (3) MI + Control-miR: 4 wks post-MI injected with Ctrl-miR; and 4) MI + Core-miRs: 4 wks post-MI injected with Core-miRs. The expression levels were normalized to Gapdh. Statistical significance was determined by one-way ANOVA with multiple comparisons and mean ± SD (n = 4). Statistically non-significant comparisons are not shown. *p < 0.05, **p < 0.01, *** p < 0.001

