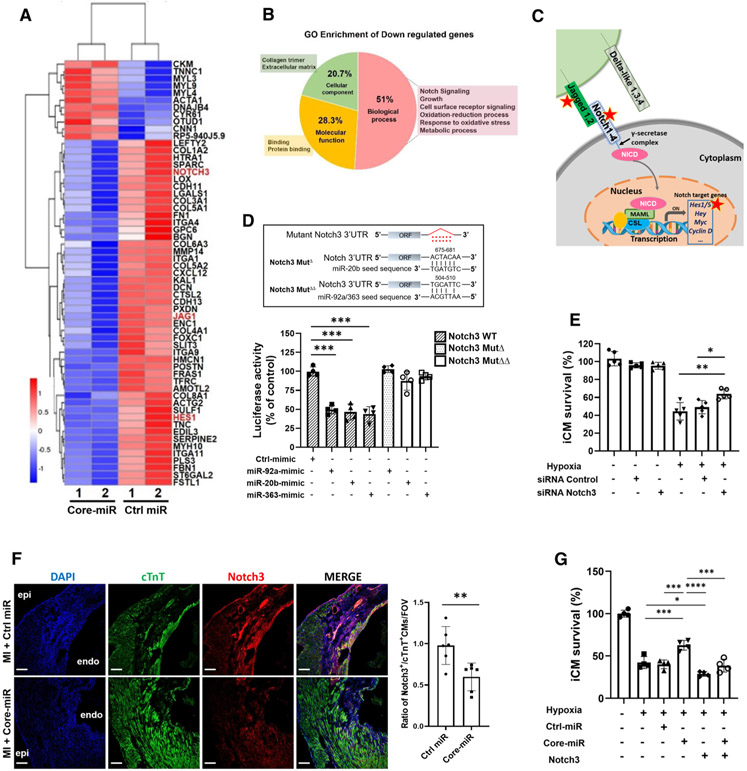
Fig. 4.
EV-derived-miR-106a–363 cluster directly targets the Notch3 signaling pathway in the injured myocardium. a Heat map of the RNA-Seq data. Hierarchical clustering analysis was carried out with the log10 (FPKM + 1) of union differential expression genes of all comparison groups under different experimental conditions. Corrected P value of 0.005 and log2 (Fold change) of 1 were set as the threshold for significant differential expression. The X-axis indicates the experimental conditions: Core-miR-mimic and Ctrl-miR-mimic transfected cells. Y-axis indicates relative expression levels. Data are representative of two independent biological replicates. All samples were collected after 18 h of hypoxia (< 1% O2) following 72 h post-transfection period of each group. b Pie Chart shows Gene Ontology (GO) enrichment in the three GO terms of down-regulated genes by the core-miRs transfected iCMs. GO analysis of differentially expressed genes was implemented by the GOseq R package in which gene length bias was corrected. GO terms with corrected P value less than 0.05 were considered significantly enriched by the differentially expressed genes. c Schematic of well-established Notch signal transduction. Briefly, once the notch extracellular domain interacts with a ligand (such as, Jagged 1,2 or Delta-like 1,3,4), the enzyme, γ-secretase, cleaves and releases the intracellular domain of the notch protein. This releases the intracellular domain of the notch protein (NICD), which moves to the nucleus to activate transcription of Notch target genes via transcription factor, CSL (CBF1, Suppressor of Hairless, Lag-1) complex. Red stars indicate the genes, which are down-regulated by Core-miRs in the pathway. d Luciferase assay of wild-type Notch3 3′UTR or mutated Notch3 3′UTR in the predicted binding site of miR-20b, and miR-92a/363 (upper panel) when transfected with Control-miR and each Core-miR. Statistical significance was determined by one-way ANOVA with multiple comparisons and mean ± SD (n = 4). e Measurement of cell survival rate of siNotch3 transfected iCMs after 18 h of hypoxia insults by MTT analysis. Statistical significance was determined by one-way ANOVA with multiple comparisons and mean ± SD (n = 5). f Immunofluorescence stain evaluated Notch3 expression in both Control-miR and Core-miR injected mouse heart tissue. A quantitative graph showed the ratio of Notch3 + cardiomyocytes (cTnT + double-positive cells) in the PIR per FOV. Scale bar: 100 μm. Statistical significance was determined by unpaired two-tailed t test and mean ± SD (n = 6). g Survival rate of hypoxia-injured iCMs was measured by MTT assay after 18 h of hypoxia. iCMs were transfected with either 50 nM of miR-mimic or 2 ug of DNA plasmid: (1) negative control miRNA mimic (Ctrl); (2) combined miR-92a, −20b, and −363 (Core-miR) mimic; and (3) Notch3 plasmid. Statistical significance was determined by one-way ANOVA with multiple comparisons and mean data ± SD (n = 4). Statistically non-significant comparisons are not shown. *p < 0.05, **p < 0.01, ***p < 0.001

