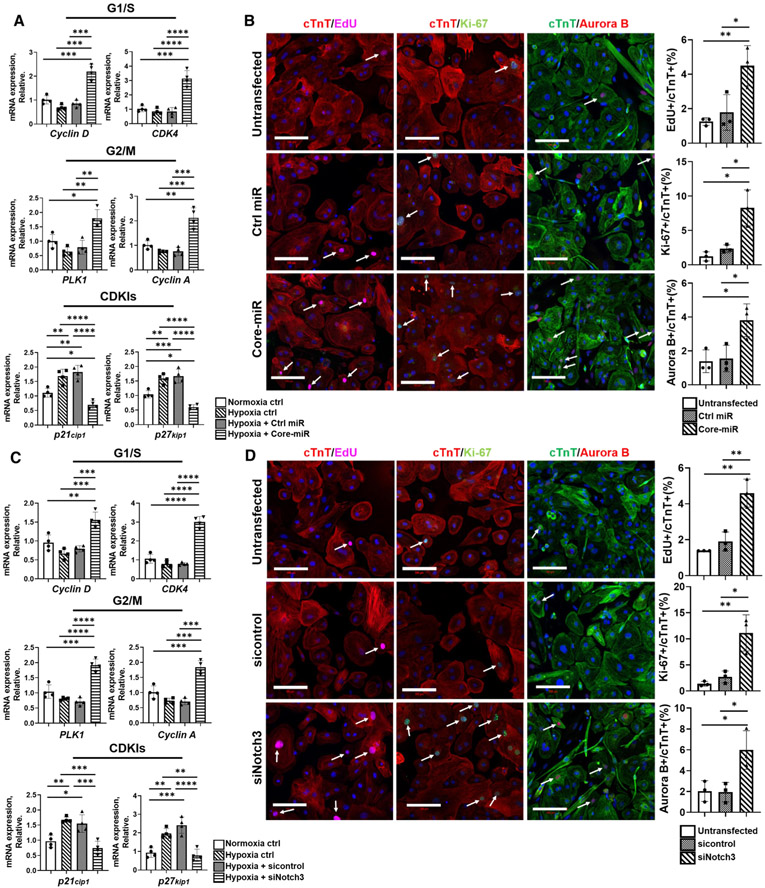
Fig. 5.
EV derived-miR-106a–363 cluster reconfigures the cell cycle regulators of cardiomyocytes via Notch3 repression. mRNA expression analysis of cell cycle positive regulators (G1/S and G2/M) and negative regulators (CDKIs) in iCMs in vitro. a Control-miR and Core-miR transfected iCMs were exposed to hypoxic insult for 18 h at 72 h post-transfection. qRT-PCR analysis evaluated the expression level of cell-cycle genes. The expression levels were normalized to GAPDH. Statistical significance was determined by one-way ANOVA with multiple comparison and mean ± SD (n = 4). b Cell-cycle protein expression immunofluorescent markers were measured: (1) EdU (5-ethynyl-2′-deoxyuridine) for S Phase, (2) Ki-67 for G1/S/G2/M Phase, and (3) Aurora B for M Phase. All groups were analyzed at 72 h post-transfection of Control-miR and Core-miR. Fluorescence colors for each antibody are indicated in the figure panels: nucleus (DAPI blue), cell cycle (Edu, Ki-67, and Aurora B), and cTnT. All cell cycle markers were located in the nucleus. Other green dot signals present in cytoplasm area are FAM-labeled miRs. Only the cell cycle marker+/cTnT+ double-positive mononuclear cells were counted from eight random areas per each group (white arrows point to the double-positive cells). Scale bars: 100 μm. All statistical significance was determined by one-way ANOVA with multiple comparisons and mean ± SD (n = 3). c siNotch3 and control siRNA transfected iCMs were exposed to hypoxia insult for 18 h at 72 h post-transfection. qRT-PCR analysis evaluated the expression level of cell-cycle genes. The expression levels were normalized to GAPDH. Statistical significance was determined by one-way ANOVA with multiple comparisons and mean ± SD (n = 4). d Expression of cell cycle markers (EdU: S Phase, Ki-67: G1/S/G2/M Phase and Aurora B: M Phase) were analyzed by immunofluorescence staining. All groups were analyzed at 72 h post-transfection of sicontrol, and siNotch3 transfected iCMs. Fluorescence color for each antibody is indicated in the figure panel: nucleus (Blue), cell cycle (Edu, Ki-67, and Aurora B), and cTnT. Only the cell cycle marker+ and cTnT+ double-positive mononuclear cells were counted from eight random areas per each group (white arrows point to the double-positive cells). Scale bars: 100 μm. All statistical significance was determined by one-way ANOVA with multiple comparisons and mean ± SD (n = 3). Statistically non-significant comparisons are not shown. *p < 0.05, **p < 0.01, ***p < 0.001, ****p < 0.0001

