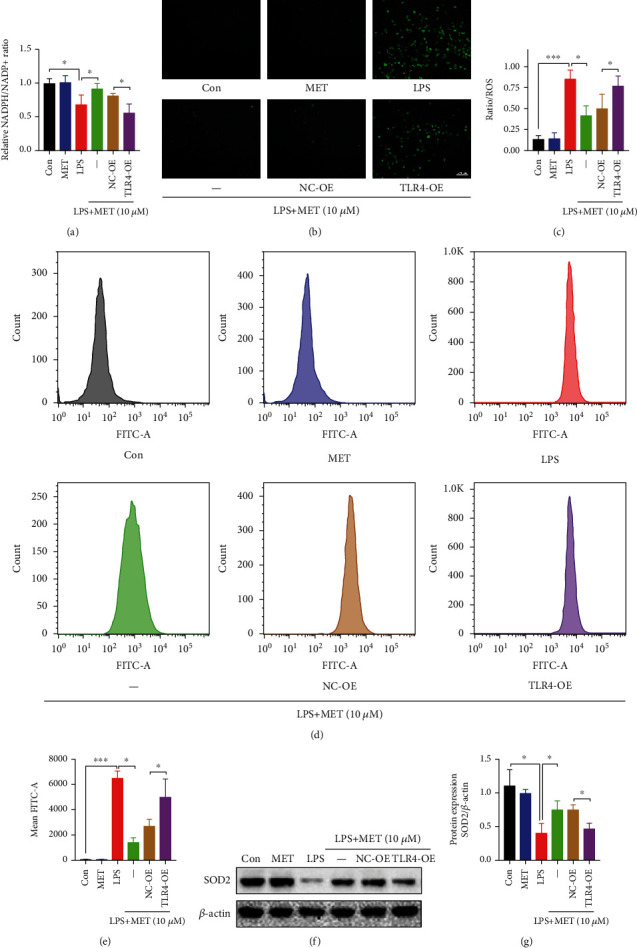
Figure 5.

Pharmacological concentration of MET restored the trophoblastic redox homeostasis partly through the inhibition of the TLR4/NF-κB signaling. HTR-8/SVneo cells were transfected with TLR4 plasmid for overexpression or negative vector; 200 ng/ml LPS and 10 μM MET were subsequently incubated. (a) The cellular levels of NADPH were measured in HTR-8/SVneo cells in different groups. (b, c) Representative images showing DCFH-DA fluorescence signals (green) indicative of ROS and the comparison of mean fluorescence intensities across different groups. Scale bar: 100 μm. (d, e) Flow cytometry analysis and quantitative analysis of cellular ROS content in different groups. (f, g) Western blot analysis of SOD2 protein expression and the densitometry quantification. Data are shown as the mean ± SD from three independent experiments. ∗P < 0.05, ∗∗P < 0.01, and ∗∗∗P < 0.001 by Student's t-test. SD: standard deviation; NC-OE: negative vector; TLR4-OE: TLR4 overexpression plasmid.
