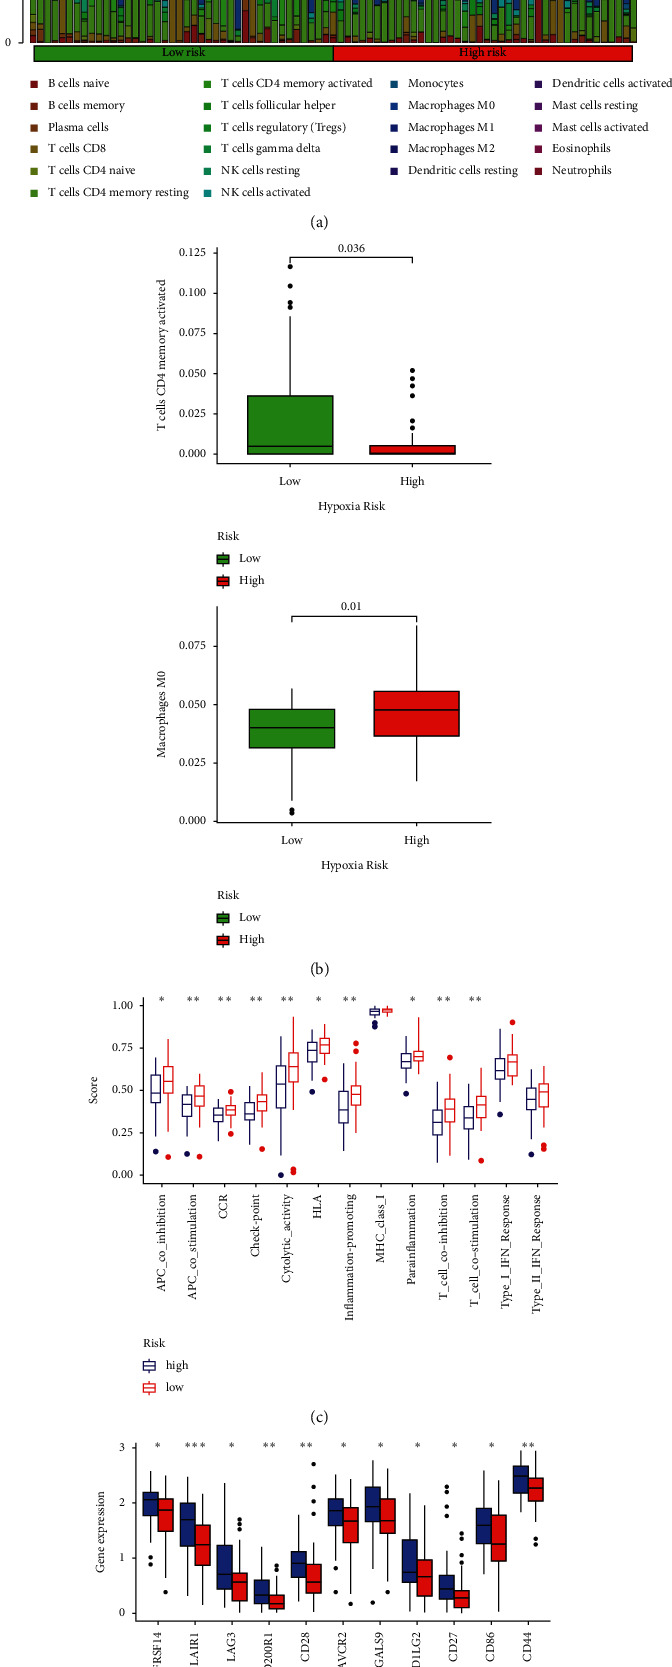
Figure 8.

A tumor-infiltrating immune cell correlation with the risk model. (a, b) Heatmap and barplot of tumor-infiltrating immune cell types in low- and high-risk groups. (c) Immune-related activities in high- and low-risk groups based on ssGSEA. (d) Differences in immune checkpoint expression between high- and low-risk groups.
