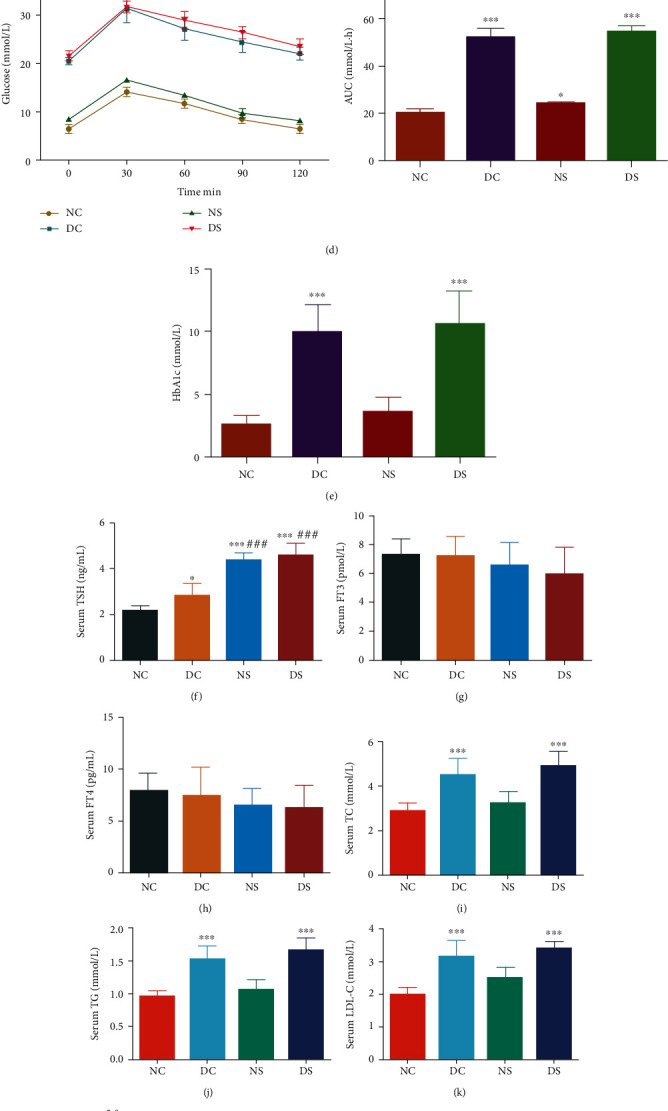
Figure 1.

Diabetic mice with SCH showing more severe glycolipid abnormality than diabetic mice without SCH. (a) The proposed mice groups and protocols. NC: normal control (n = 7); DC: diabetic control (n = 7); NS: normal SCH induction (n = 7); DS: diabetic SCH induction (n = 7). (b) Body weight of mice. SCH induction increased the body weights of both control and diabetic mice. (c) Serum fasting blood glucose (FBG) levels and (d) curve showing the variation in oral glucose tolerance test (OGTT) results with time. T2DM mice showed an abnormal glucose tolerance curve, with SCH induction enhancing this abnormal glucose metabolism. (e) HbA1c levels in mice. Serum (f) TSH, (g) FT3, and (h) FT4 levels. (i–l) Lipid levels corresponding to the four mice groups. Serum (m) leptin, (n) adiponectin, (o) insulin levels, and (p) HOMA-IR in mice. Blood glucose homeostasis was disturbed in both DC and NS mice. SCH: subclinical hypothyroidism. All data are presented as mean ± SD; a one-way ANOVA was used to analyze (b, d, f, g, h, m–o), and nonparametric Kruskal-Wallis test was used to analyze (c, e, i–l, p) (∗P < 0.05, ∗∗P < 0.01, and ∗∗∗P < 0.001, compared with the NC mice; #P < 0.05, ##P < 0.01, and ###P < 0.001, compared with DC mice).
