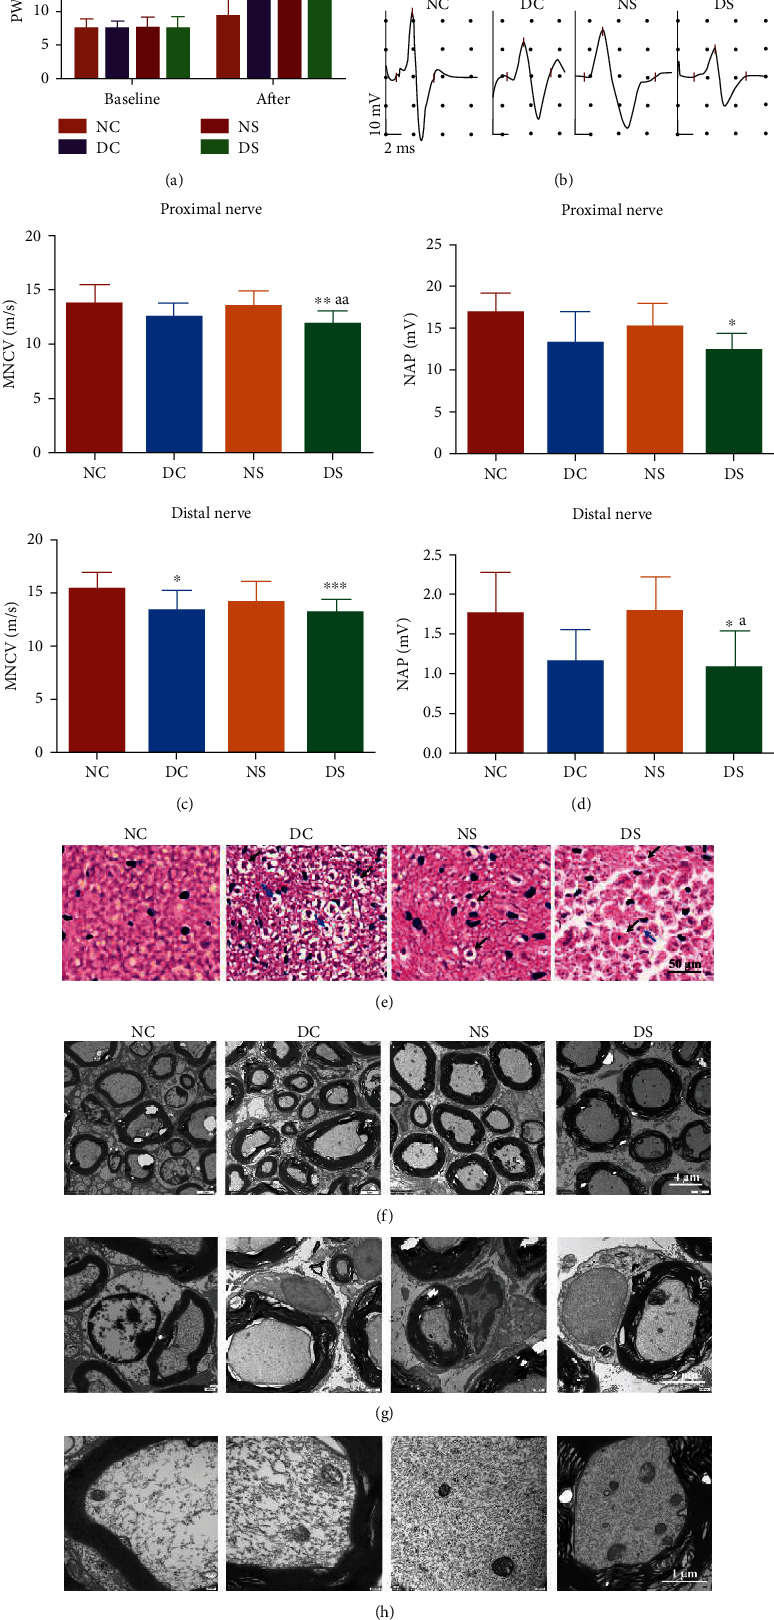
Figure 2.

Animal behavior and pathophysiology. (a) Paw withdrawal latency (PWL) owing to heat stimulation. The bar graphs illustrate the results corresponding to the NC, DC, NS, and DS groups at baseline and at 25 weeks after grouping. At baseline, the different mice groups showed no PWL differences in response to heat stimulation (n = 7). (b) Representative electroneurogram of mice (n = 6). Bar charts showing the comparison of (c) MNCV and (d) NAP corresponding to the proximal and distal nerve, respectively. MNCV: motor nerve conductive velocity; NAP: nerve action potentials. (e) Representative H&E staining images of sciatic nerve cross-section. The sciatic nerves of mice in the DC or DS groups exhibited substantial vacuolar-like defects (black arrows) and axonal shrinkage (blue arrows). Magnification, 400x. (f–h) Ultrastructure of sciatic nerve cross-sections based on TEM. Representative sciatic nerve images of mice in the NC, DC, NS, and DS groups at a magnification of (f) 8000x, (g) 20000x, and (h) 40000x. NC: normal control; DC: diabetic control; NS: normal SCH induction; DS: diabetic SCH induction. All data are presented as mean ± SD, a one-way ANOVA was used to analyze (a, d), and nonparametric Kruskal-Wallis test was used to analyze (c) (∗P < 0.05, ∗∗P < 0.01, and ∗∗∗P < 0.001, compared with the NC group; #P < 0.05, ##P < 0.01, and ###P < 0.001, compared with the DC group; aP < 0.05, aaP < 0.01, and aaaP < 0.001, compared with the NS group).
