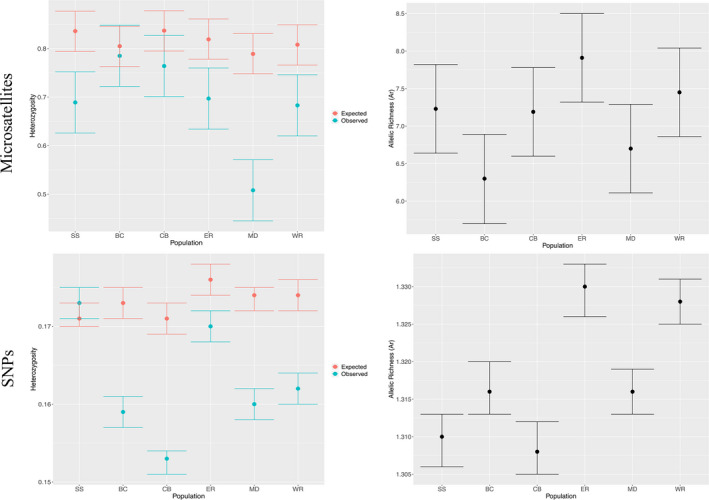
FIGURE 2.

Genetic diversity estimates (dots) with 95% confidence intervals (error bars) per black‐capped vireo population: BC, CB, ER, MD, SS, WR. Observed and expected heterozygosity (blue and orange, respectively) per population in the left panel and allelic richness (A r, in black) per population on the right panel. Estimates in which their 95% confidence intervals overlap are not statistically different
