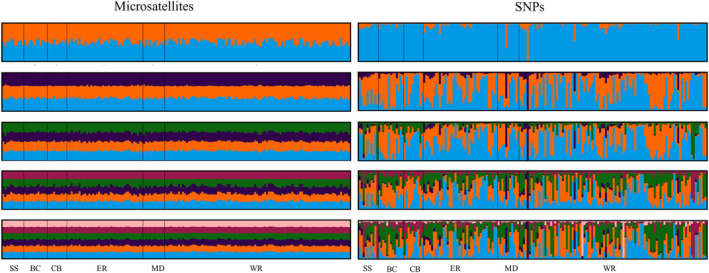
FIGURE 4.

Weak to no population structuring among Blackbcapped vireo populations (BC, CB, SS, ER, MD, and WR). STRUCTURE barplots for k values (number of unique clusters) 2 through 4. Each vertical line represents the genetic signature of an individual with colors representing each cluster
