
FIGURE 4.
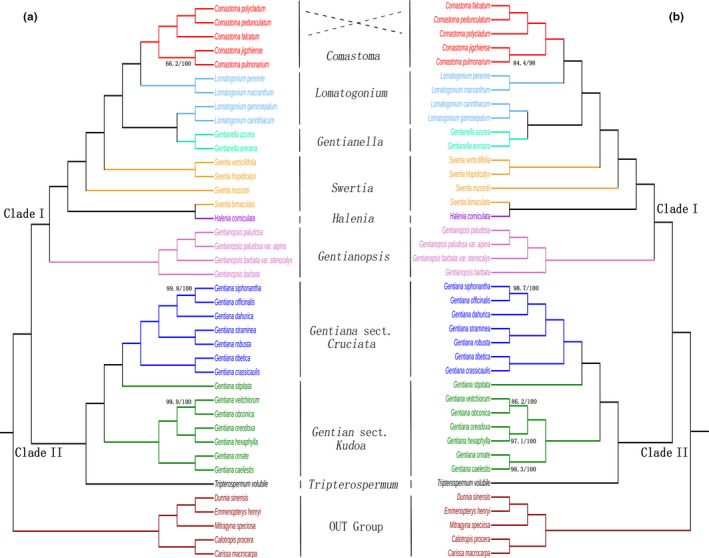
Phylogeny of Comastoma based on the maximum likelihood and Bayesian inferred trees (a) ML/BI tree based on complete chloroplast genomes of a concatenated data matrix. (b) ML/BI tree including only the protein‐coding sequences. A support rate less than 100 has been shown on the branches, where the first value represents the support rate of ML‐based statistics and the second value that of BI inferences