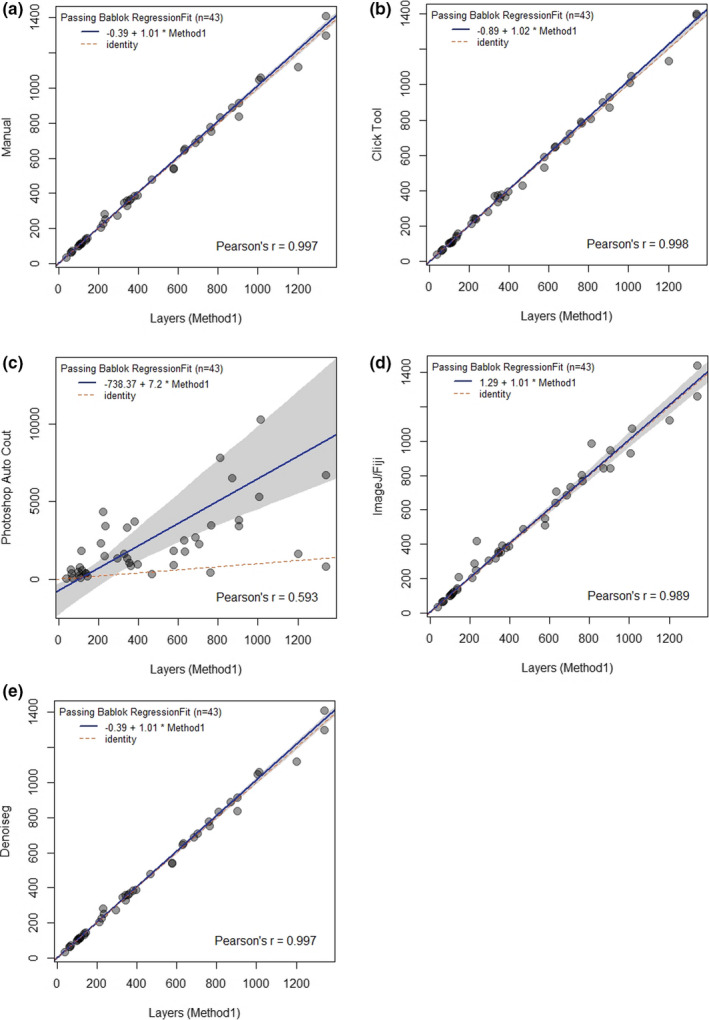
FIGURE 4.

Comparison of methods using the Passing Bablok regression. The graphs show the records with the regression line (solid line), the confidence interval for the regression line (dashed lines), and the identity line (x = y, dotted line). Comparison between the proxy methods and other methods: (a) – Manual, (b) – Click Tool, (c) – Photoshop Autocount, (d) – ImageJ/Fiji, and (e) – DenoiSeg + ImageJ/Fiji
