FIGURE 2.

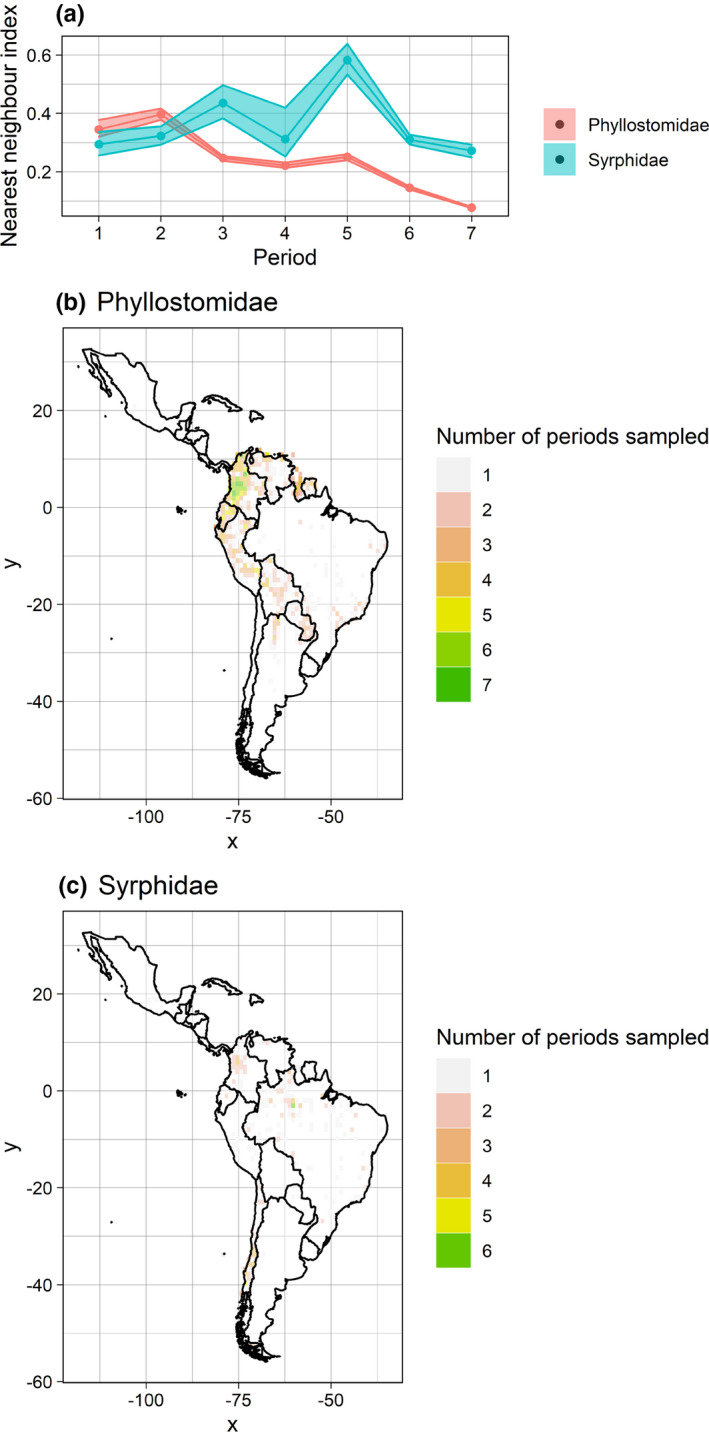
ggplot2 objects returned by assessSpatialBias (a) and assessSpatialCov (b and c). Note that the user can modify these plots (e.g., by changing colours, axis labels, etc.)

ggplot2 objects returned by assessSpatialBias (a) and assessSpatialCov (b and c). Note that the user can modify these plots (e.g., by changing colours, axis labels, etc.)