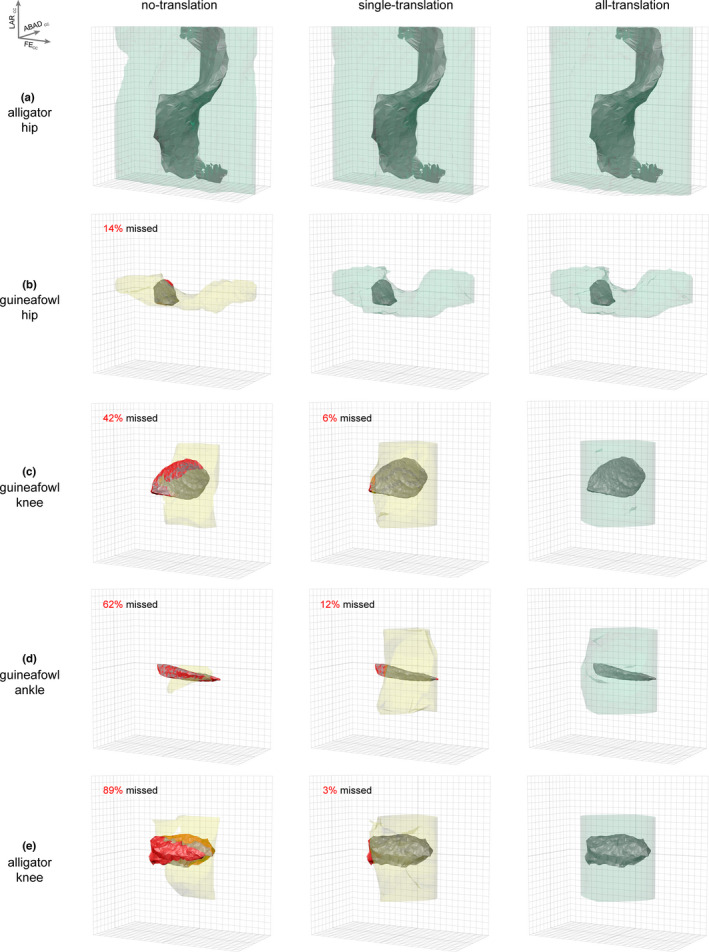
FIGURE 3.

Osteological ROM estimation can result in three potential outcomes. Analyses may succeed in capturing true mobility (a) with no translation allowed, (b) with just distraction–compression translation, or (c–e) only with all three translational degrees of freedom. Rotational mobility results for no‐translation, single‐translation, and all‐translation simulations are displayed for the (a) alligator hip, (b) guineafowl hip, (c) guineafowl knee, (d) guineafowl knee, and (e) alligator knee as colored, transparent polygonal envelopes. Bolded gridlines represent 0 degrees; gridlines are 15 degrees apart. Axis orientation is in the upper left where FECC = cosine‐corrected flexion–extension rotation, ABADCC = cosine‐corrected abduction–adduction rotation, and LARCC = cosine‐corrected long‐axis rotation. Alpha shapes representing the true cadaveric mobility of each joint are displayed in opaque gray. If true mobility was not captured, missed regions are highlighted in red, the simulation alpha shape is yellow, and the percent missed is reported; if true mobility was successfully captured, the simulation alpha shape is green. See also Movies S2–6
