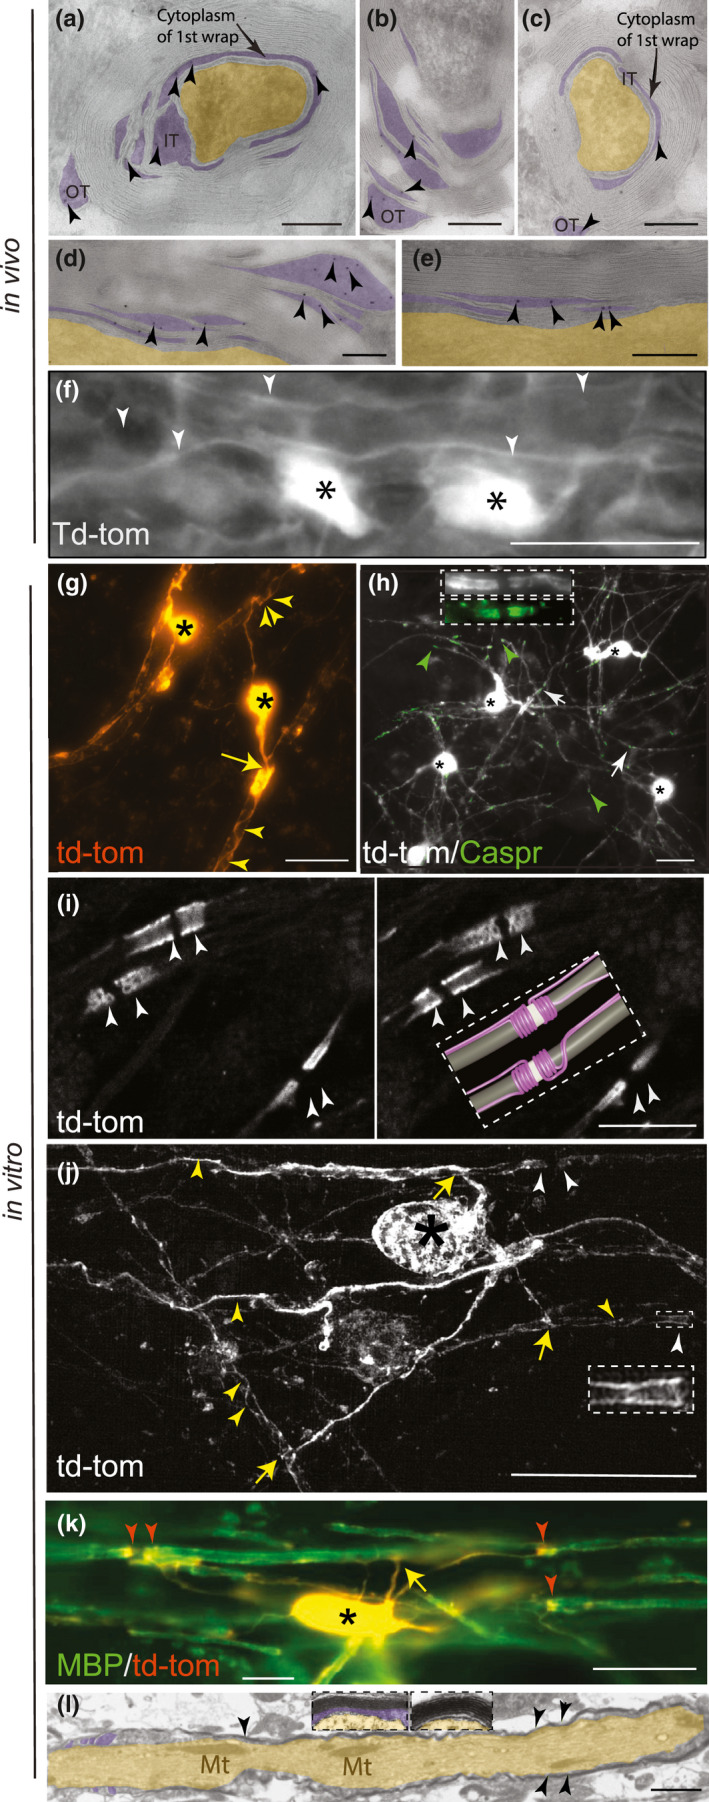
FIGURE 2.

Td‐tomato fluorescent protein delineates the myelinic channel system in vivo (part 1). Transverse (a–c) and longitudinal (d–e) sections of adult murine myelinated optic nerve fibres. (a–e) Immunoelectron microscopy showing localisation of antibody to td‐tomato (10 nm gold particles, indicated by arrowheads) in cytoplasm‐containing regions (purple overlay) of the myelin sheath including the inner tongue (IT), outer tongue (OT), between layers of the 1st wrap (arrows), and between layers of compact myelin. The axon is overlaid in yellow. Bars: 200 nm. (f) Epi‐fluorescence microscopy of td‐tomato rendered oligodendrocytes (asterisks) in adult murine spinal cord longitudinal section, showing myelin sheaths (white arrowheads) running in parallel. Bar: 20 µm. Td‐tomato fluorescent protein delineates the myelinic channel system in vitro (part 2). (g) Epi‐fluorescence microscopy live imaging of td‐tomato rendered myelinating oligodendrocytes in vitro. Two cell bodies (asterisks) can be observed forming myelin sheaths. The yellow arrow points to the point of contact between a major process and the myelin sheath while the white arrow heads highlight coils of td‐tomato rendered cytoplasm. Bar: 20 µm. (h) Epi‐fluorescence microscopy images of td‐tomato rendered oligodendrocytes (asterisks mark the cell bodies) in which Caspr1 stained paranodes (green; arrowheads) coincide with termini of myelin sheaths. Occasionally, in these sparsely labelled cultures, adjacent td‐tomato positive sheaths form a node of Ranvier (white arrows and Supplementary Figure 2). Inset shows a higher magnification view of a node of Ranvier from a different field of view. (i) Two consecutive z‐steps, 0.32 µm apart, captured using a confocal microscope illustrate td‐tomato labelling of paranodes on two large diameter fibres and one smaller fibre. An idealised model, inferred from viewing the entire z‐stack (Supplementary movie 2I) is provided for context. The internodal axon is depicted in grey, the node of Ranvier in white and the loops and inner and outer tongues in magenta. Bar: 10 µm. (j) Maximum intensity projection of a super‐resolution z‐stack (0.2 µm steps) of a td‐tomato rendered cell, showing the paranodal loops at higher resolution (white arrowheads and inset). The yellow arrows point to the point of contact between a process and its myelin sheath while the yellow arrowheads highlight coils of td‐tomato rendered cytoplasm. Bar: 20 µm. These details can be observed also in Supplementary movies 2J (1 and 2). (k) Epi‐fluorescence microscopy captured image of MBP (green), which labels compact myelin. The cell body (asterisk), processes (one of which is indicated by the yellow arrow) and paranodes (red arrowheads) are td‐tomato positive and MBP negative. Bar: 20 µm. (l) Electron micrograph of a longitudinal section of a myelinated axon demonstrating that compact myelin (arrowheads) forms in this in vitro model. Paranodal loops can be observed on the left of the image. Insets show higher magnification views of transverse sections of myelinated fibres. Cytoplasm‐containing regions of myelin overlaid in purple, axon overlaid in yellow. Axonal mitochondria (Mt) are indicated. Bar: 250 nm
