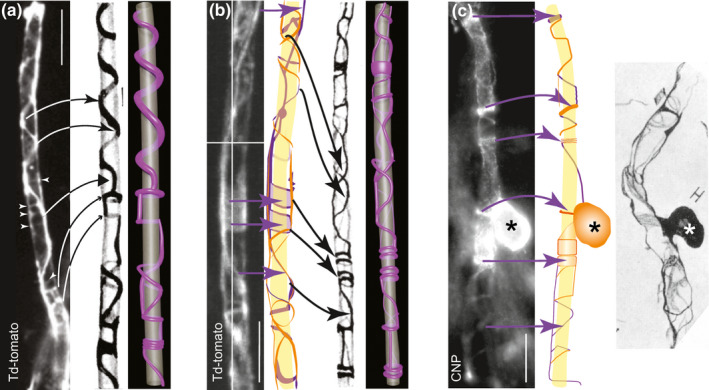
FIGURE 3.

Td‐tomato fluorescent protein and anti‐CNP labelling illuminate the myelinic channel system in a manner resembling the drawings of Río‐Hortega. (a) Live image taken using a widefield epi‐fluorescence microscope of a td‐tomato rendered sheath (the entire cell can be seen in Figure 4). Features similar to these in Figure 55E from Río‐Hortega (1928), including spiralling coils with bell‐shaped peaks (thin arrow heads), flat peaks (thick arrowhead) and rings or bangles (small arrow heads) are indicated. White arrowheads draw attention to faint labelling. Our 3D model of Río‐Hortega’s drawing is shown alongside (see also Supplementary movie 3A). (b) Maximum intensity projection (MIP) of a confocal z‐stack of a td‐tomato‐rendered sheath of a live cell, taken using a spinning disc confocal microscope (see also Supplementary movie 3B of the z‐stack), alongside a drawing made from the individual z‐plane images (purple behind; orange in front; the axon in yellow has been extrapolated from the myelinic channel data), reminiscent of Figure 55B from Río‐Hortega (1928), alongside our 3D model. Purple arrows indicate features of the fluorescence micrograph reproduced in the digital drawing. Black arrows indicate features similar to those seen in the drawing of Río‐Hortega. (c) MIP of a z‐stack of a CNP‐stained cell taken using a widefield epi‐fluorescence microscope, next to its trace made from the individual focal planes (purple behind; orange in front; extrapolated axon in yellow), alongside Figure 50H from Río‐Hortega (1928) showing his ‘monopolar’ Schwannoid type 4 cell. The location of the CNP‐stained cell body (asterisks) with respect to the sheath, and the presence of both thick and thin bands of cytoplasm appear similar to those features in Río‐Hortega’s drawing. Bars: 10 µm
