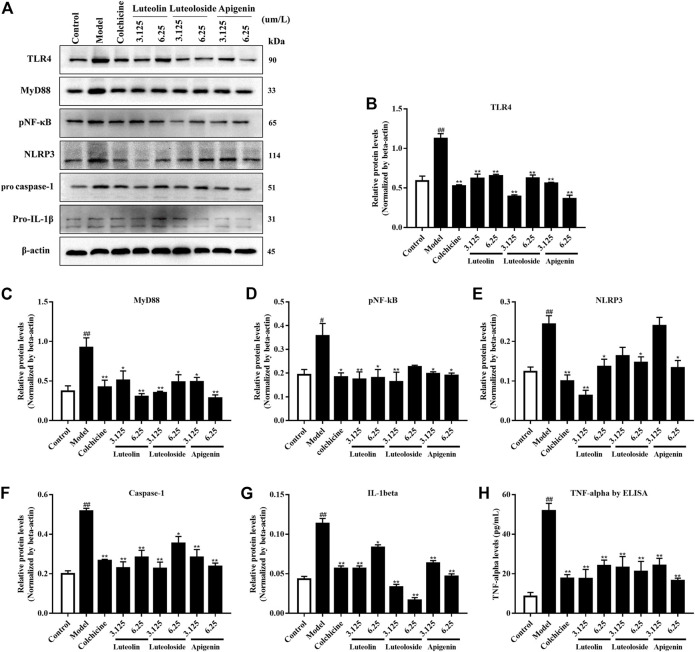
FIGURE 4.
The effects of the active flavonoids luteolin, luteoloside, and apigenin on the TLRs/MyD88/NF-κB pathway, NLRP3/caspase-1/IL-1β expression, and TNF-α levels in MSU crystal-induced Raw264.7 cells (n = 4). The representative western bands are shown in panel (A). The changes in TLR4 (B), MyD88 (C), pNF-κB (D), NLR family pyrin domain-containing 3 (NLRP3) (E), pro caspase-1 (F), and pro-IL-1β (G) are shown as histograms. (H) TNF-α levels by ELISA assay. # p < 0.05 and ## p < 0.01 vs. control group; *p < 0.05 and **p < 0.01 vs. model group.

