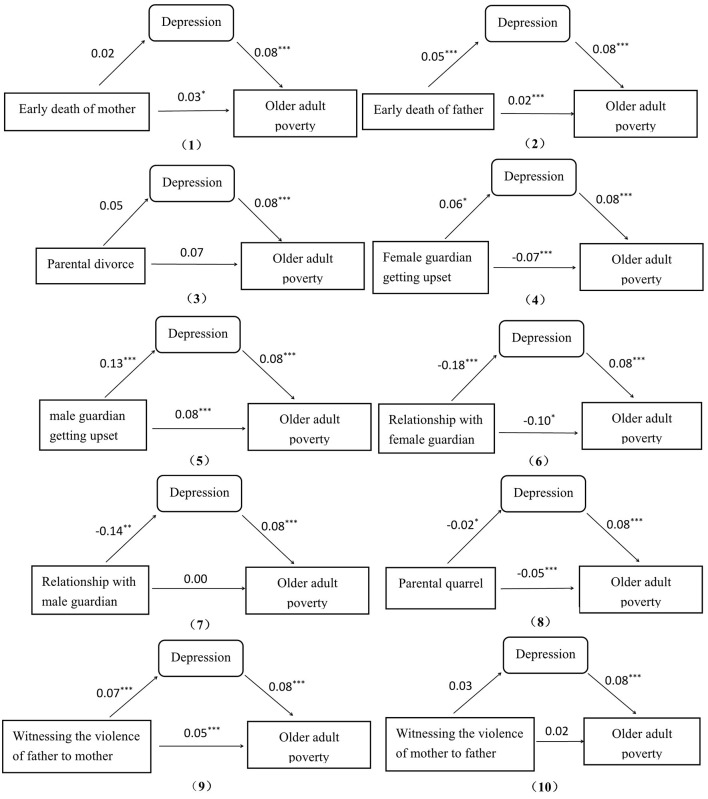
Figure 1.
Path diagram of effects. *p < 0.05, **p < 0.01, ***p < 0.001. The effect values were output from a path analysis that took 10 ACE factors as exogenous variables, depression as a mediating variable and older adult poverty as the endogenous variable using AMOS 23. (2, 5, 6, 8, 9) indicate having a mediating effect and others do not.

