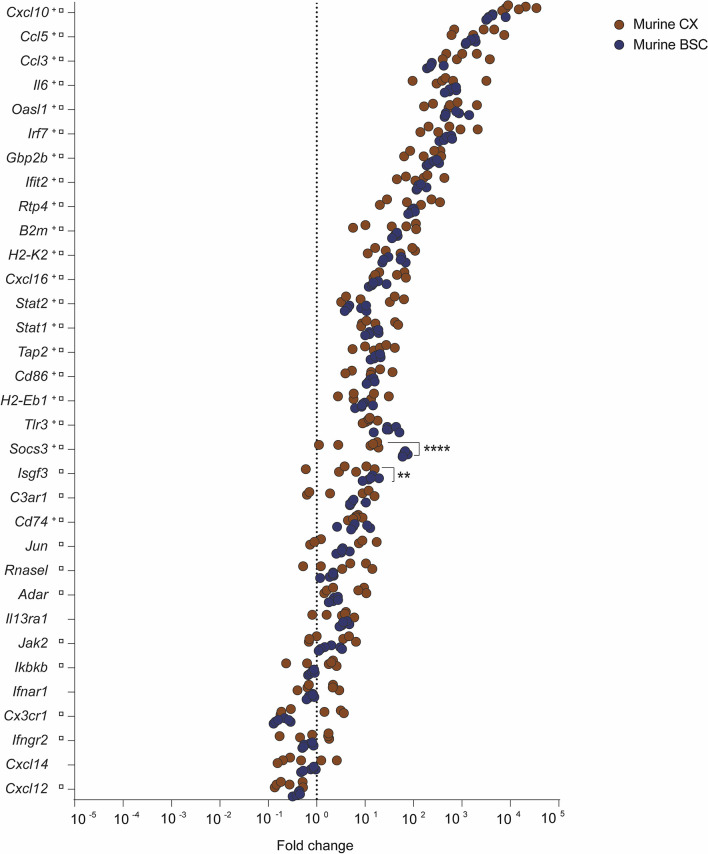
Figure 1.
Inflammatory transcription profile of murine CX and BSC upon RABV strain Tha infection at day 8 post-infection. Scatter plot shows gene expression fold changes in murine CX (n=6) and BSC (n=6), upon Tha infection. Fold changes were calculated based on normalization with the geomean of housekeeping genes Actb and Gapdh ( Supplementary Figure S1 ) as well as non-infected murine CX (n=6) and non-infected BSC (n=6), respectively. Differential expression was calculated by comparing the gene expression (ΔΔCT values) between murine CX and BSC with the Šídák’s multiple comparisons test (adjusted p-value ****< 0.0001, **< 0.01). Gene expression in the murine CX (+) or murine BSC ( □ ) that differed significantly from non-infected controls is marked accordingly. A detailed overview of the differential gene expression analysis can be found in Supplementary Table S4 .

