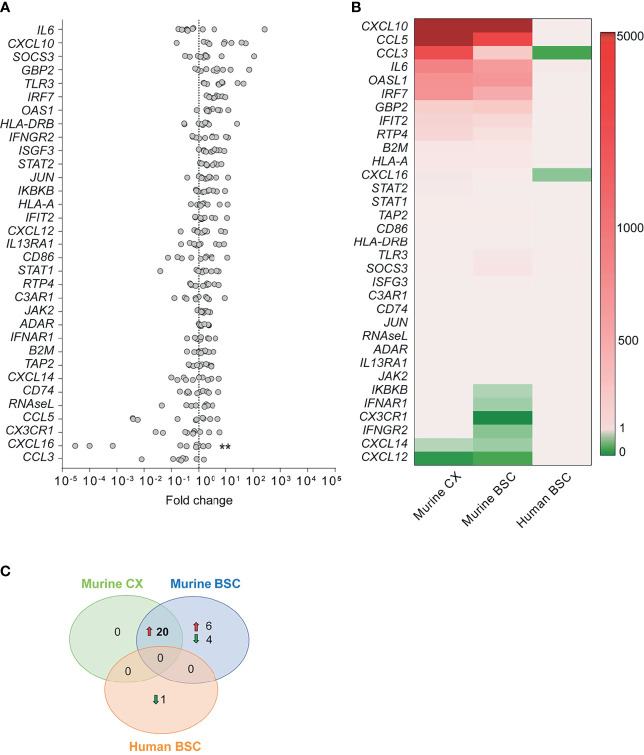
Figure 3.
Human transcription profile upon RABV infection. (A) Gene expression fold changes in post-mortem brain biopsies of the BSC of rabid patients (n=10) normalized to non-rabid patients (n=4). Differential expression was calculated by comparing the gene expression (ΔCT values) between rabid patients (n=10) and non-rabid (control) patients (n=4) by using the Šídák’s multiple comparisons test (** adjusted p-value < 0.01). A detailed overview of the differential gene expression analysis can be found in Supplementary Table S4 . (B) Heatmap comparing the expression of inflammatory genes between RABV Tha strain-infected murine CX (n=6) and BSC (n=6), and RABV-infected human BSC (n=10). Heatmap presents gene expression fold changes calculated from normalized gene expression values (ΔΔCT) of infected animals and humans to the respective non-infected controls (murine CX [n=6]; murine BSC [n=6]; human BSC [n=4]). Gene names are indicated in the human gene name nomenclature although expression indicates quantification of human or murine genes depending on the tissue investigated. (C) Number of differentially expressed genes showing the same tendency (up- or downregulation) in the RABV Tha strain-infected murine CX (n=6) or BSC (n=6), and RABV-infected human BSC (n=10). Differential gene expression was calculated to non-infected mice (n=6) or human controls (n=4), respectively. A detailed overview of the differential gene expression analysis can be found in Supplementary Table S4 .

