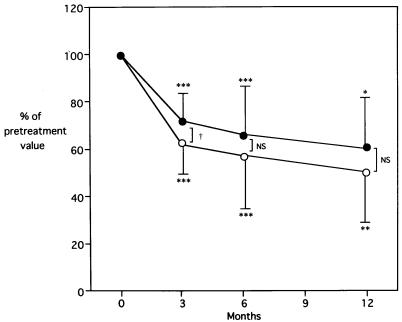
FIG. 1.
Levels of serum anti-CagA (open circles) and anti-H. pylori IgG antibodies (solid circles) after eradication therapy in 16 patients. Mean posttreatment levels at specified follow-up times are expressed as percentages of pretreatment levels. Error bars, standard deviations. ∗, P < 0.05 versus pretreatment level; ∗∗, P < 0.01; ∗∗∗, P < 0.001. NS, not significant. †, P < 0.05, comparing anti-H. pylori and anti-CagA antibodies.

