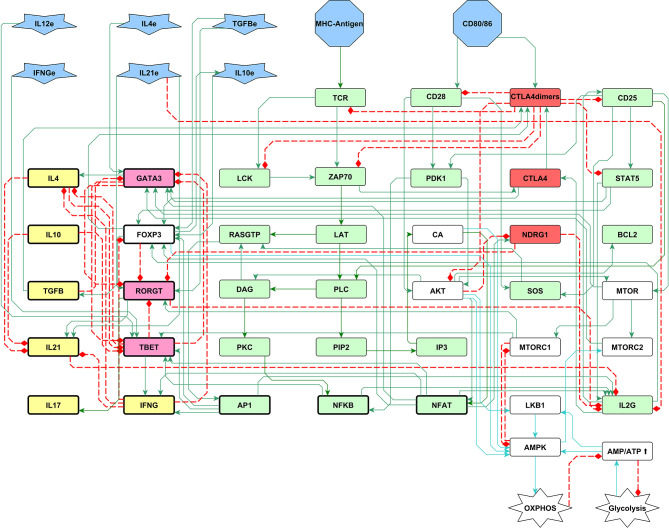
Figure 3.
A 51-node network of the early biochemical interactions induced by TCR activation, co-stimulation, and phenotype-inducing cytokines. Inputs of the network are the MHC-antigen, the co-stimulatory molecules CD80/86, and external cytokines (blue polygons). The set of interacting rules defining the dynamical system for Boolean modeling is shown in Supplementary Material 1 . Boolean rules were translated to continuous functions as shown in Material and Methods, and the complete set of ordinary differential equations is provided in Supplementary Material 2 . Green and red rectangles represent stimulatory and inhibitory nodes of the activation core, respectively. Pink and yellow rectangles represent phenotype-inducing transcription factors and cytokines produced endogenously, respectively. White rectangles represent the metabolism module including AMPK as a central regulatory element, as shown in figure 2. Construction of the network can be consulted in (40). LAT: LAT-Gads-SLP-76 complex; IL2G: IL-2 gene; L4e, IFNγe, IL10e, TGFβe and IL21e: exogenous cytokines.

