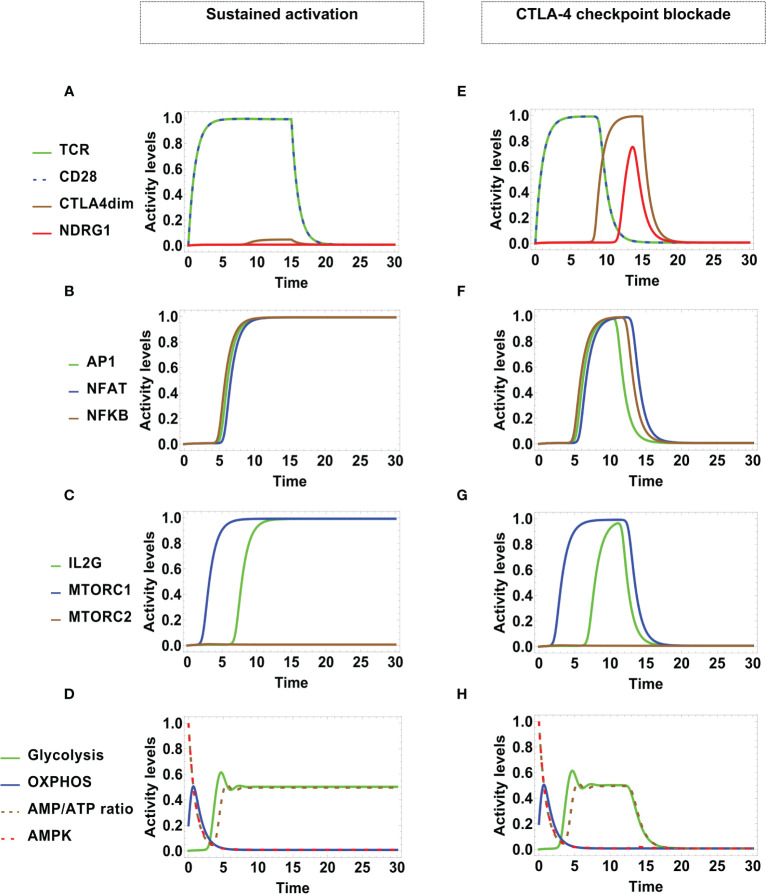
Figure 4.
Dynamics of transcription factors and metabolism under optimal engagement conditions of TCR with the MHC-antigen complex, and CD28 with CD80/86, during a stimulation time τ MHC / A = τ CD 8086 = 15 units. Left panel: Sustained T-cell activation associates to low-level activity of CTLA-4 (with high decay rated dCTLA 4 = 5). (A) TCR and CD28 are fully activated as far as antigenic stimulation persists, leading to (B) sustained expression of the transcription factors AP-1, NFAT, and NFκB, and (C) sustained expression of mTORC1 and IL-2. (D) Metabolic profile: After initial activation, the AMP/ATP ratio decreases, leading to a reduction of the activity of the nutrient sensor AMPK and a temporary increment of OXPHOS. With the course of time, OXPHOS decays and glycolytic activity increases up to a steady level, in parallel with the AMP/ATP ratio. Right panel: Checkpoint blockade associated to high-level activity of CTLA-4 (with low decay rate dCTLA 4 = 0.5). (E) Initially, TCR and CD28 are fully activated. With the course of time, the expression level of dimerized CTLA-4 increases, displacing CD28 from co-stimulatory molecules, with the concomitant induction of anergy. This is manifested as (F) transitory expression and down-regulation of the activation transcription factors AP-1, NFAT, NFκB, and (G) transitory expression and down-regulation of mTORC1 and IL-2. (H) Metabolic profile: At the beginning, the metabolic activity shows an identical pattern as in the case of sustained activation; eventually, the inhibitory action of CTLA-4 induces the decay of glycolysis.

