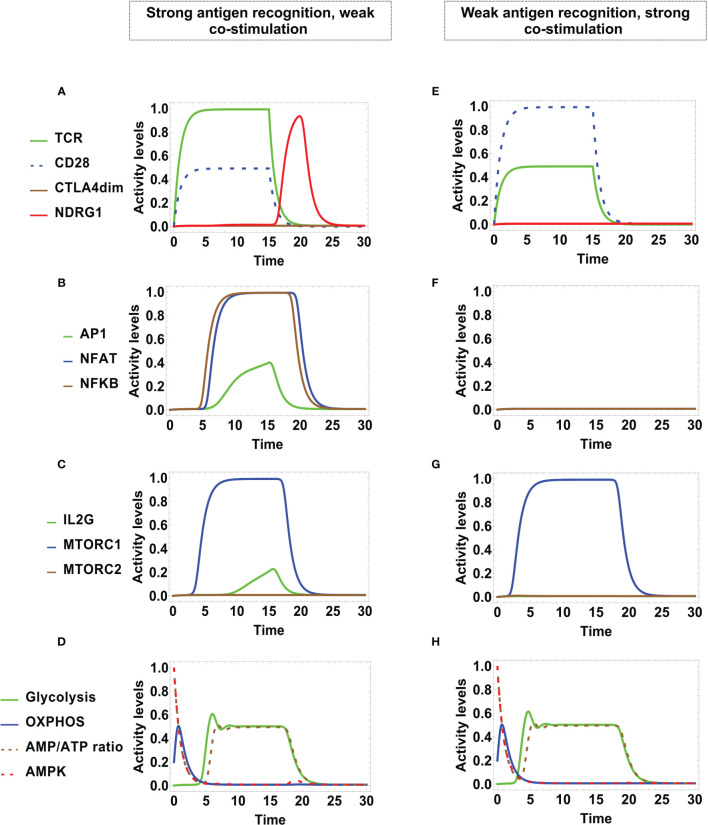
Figure 6.
Dynamics of transcription factors and metabolism after incomplete stimulation during an activation time τ MHC / A = τ CD 8086 = 15 units. Left panel: Anergy is induced by strong TCR stimulation and weak CD28 co-stimulation (A MHC / A = 1 and A CD 8086 = 0.5). (A) TCR and CD28 are transiently activated, decaying both at time τ MHC / A = τ CD 8086. At this time the anergy factor NDRG1 is temporarily expressed. (B) NFAT, NFκB, and AP-1 are down-regulated by the inhibitory action of NDRG1. (C) Similarly, mTORC1 and IL2 are only transiently expressed. (D) The metabolic profile is similar to that associated to regulated activation induced by CTLA-4 ( Figure 4H ). Right panel: Anergy is induced by weak TCR stimulation and strong CD28 co-stimulation (A MHC / A = 0.5 and A CD 8086 = 1. (E) TCR and CD28 show full and low -level activation, respectively, both decaying at time τ MHC / A = τ CD 8086; however, the anergy factor NDRG1 remains unexpressed. (F). NFAT, NFκB, and AP-1 are unexpressed. (G) mTORC1 is fully activated, but decays along the antigenic stimulation. (H) The metabolic profile is similar to that associated to regulated activation induced by CTLA-4 ( Figure 4H ).

