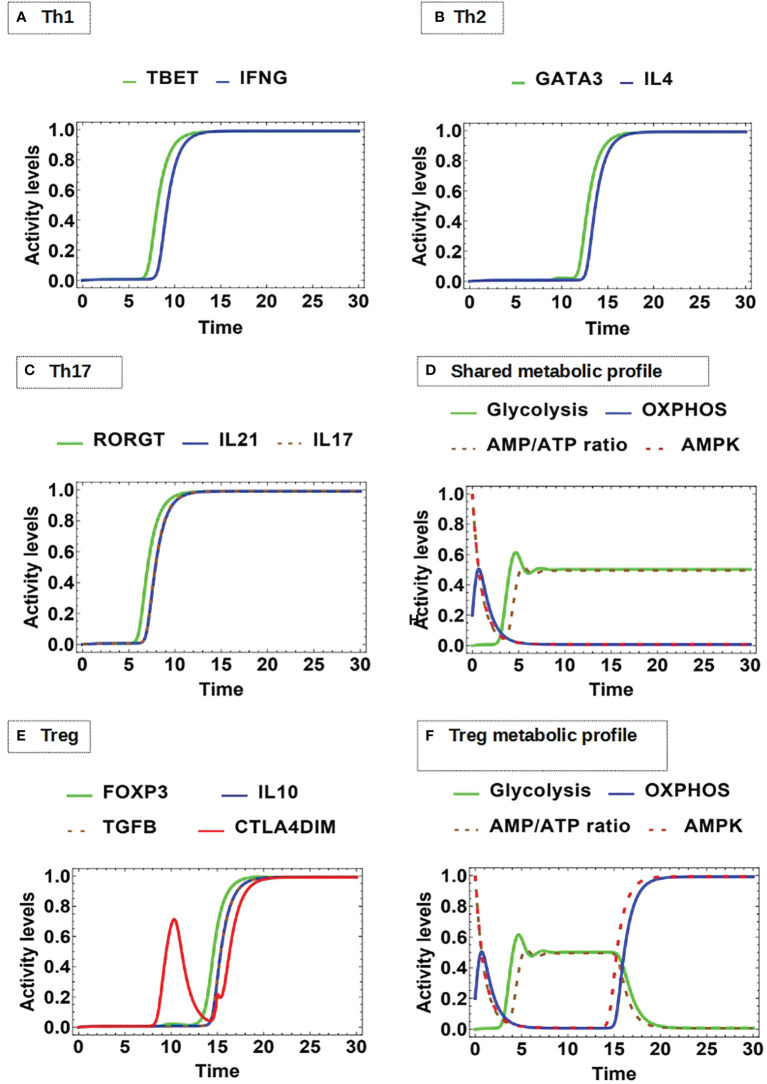
Figure 7.
Dynamics of master transcription factors and interleukin production by effector cells under optimal antigenic recognition and low-level activity of CTLA-4: (A) Th1 profile: Sustained expression of T-bet and INF-gamma production, (B) Th2 profile: Sustained expression of GATA3 and IL-4 production, (C) Th17 profile: Sustained expression of RORγT, as well as Il-17 and IL-21 production. (D) The Th1, Th2, and Th17 phenotypes display an initial transient OXPHOS phase and then a stable glycolytic metabolism. (E) Treg profile: Sustained expression of Foxp3 and dimeric CTLA-4 with joint production of IL-10 and TGF-β. (F) Treg displays an initial transient OXPHOS phase followed by glycolytic metabolism; however, with the course of time this is replaced by a metabolism based on OXPHOS.

