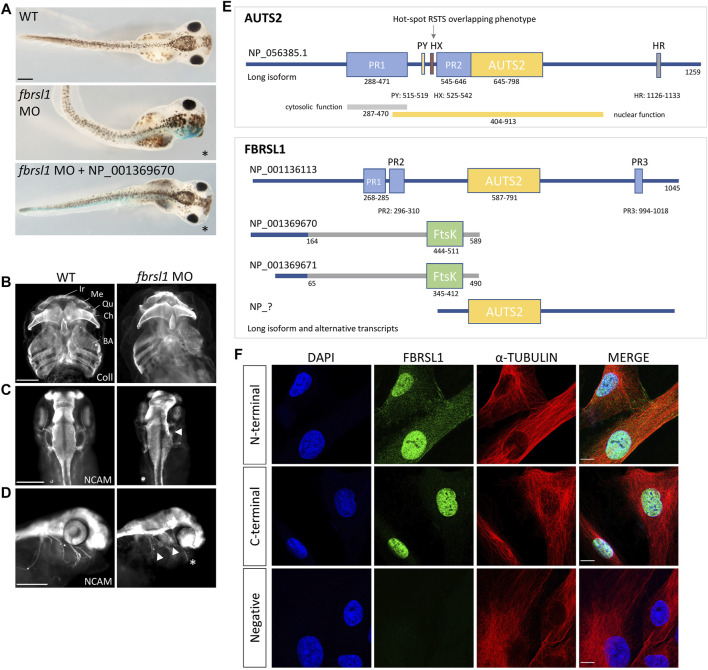
FIGURE 1.
Fbrsl1 knockdown phenotypes in Xenopus laevis and cellular localization of distinct human FBRSL1 transcripts. (A) Knockdown of Fbrsl1 by injection of a fbrsl1 Morpholino oligonucleotide (MO) leads to craniofacial defects that can be rescued by co-injection of RNA coding for the human short N-terminal FBRSL1 isoform NP_001369670 (Ufartes et al., 2020). LacZ RNA was co-injected as a lineage tracer, the injected side is marked by blue staining. (B) Anti-Collagen Type II immunofluorescence visualizes the cartilage and indicates cartilage hypoplasia on the fbrsl1 MO-injected side. BA, branchial arches; Ch, ceratohyal; Ir, infrarostral; Me, Meckel’s cartilage; Qu, quadrate. (C) Neural cell adhesion molecule (NCAM) staining shows reduced brain size and (D) impaired outgrowth of cranial nerves on the fbrsl1 MO-injected side; * marks the injected side. Scale bar in A-D: 500 µm. (E) Human FBRSL1 transcripts/isoforms compared to the human AUTS2 long isoform as previously published (Sultana et al., 2002; Oksenberg and Ahituv, 2013; Sellers et al., 2020). Like its AUTS2 ohnolog, the long isoform has a AUTS2 domain and proline rich (PR) regions (predicted with MobiDB (Piovesan et al., 2020)). Both short N-terminal isoforms differ in their C-terminal sequence from the long isoform (presented in grey) due to an alternative exon 3, which contains an Ftsk-domain. In addition, a predicted C-terminal isoform (marked with “?“) including the AUTS2 domain is shown as this isoform was validated for mouse Fbrsl1. PR, proline-rich domain; PY, PPPY motif; HX, hexanucleotide repeat; HR, trinucleotide (H) repeat; AUTS2, AUTS2/FBRSL1/FBRSL homology region. (F) Immunofluorescence analysis performed on human fibroblasts. Antibodies directed against the N-terminal as well as the C-terminal part of FBRSL1 detected FBRSL1 isoforms (green) in the nucleus. However, only the N-terminal FBRSL1 antibody also detected FBRSL1 in the cytoplasm, suggesting that the short N-terminal FBRSL1 isoforms show cytoplasmic and nuclear localization. The negative control showed no signal. Cytoskeletal staining was detected using an α-Tubulin antibody and nuclei were stained using DAPI. Images were obtained using a confocal laser microscope with ×600 magnification. Scale Bar: 10 µm. All experimental data have been previously published (Ufartes et al., 2020).

