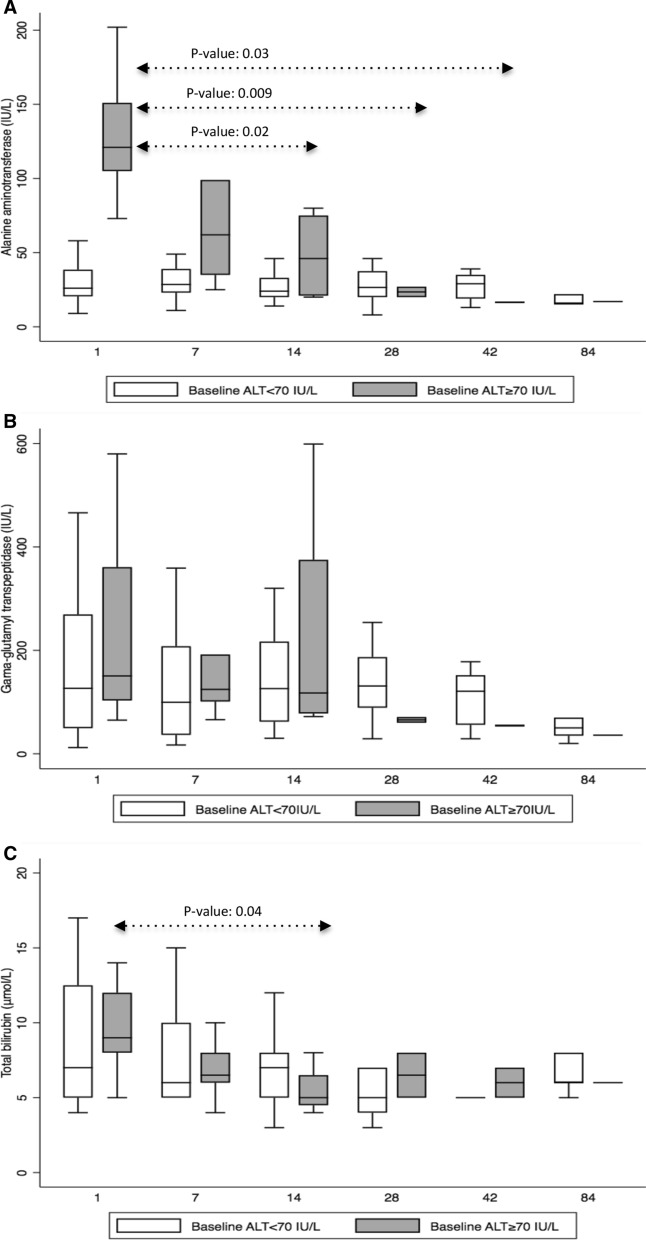
Fig. 2.
Distribution of (a) alanine aminotransferase (ALT; IU/L), (b) gamma-glutamyl transferase (γ-GT; IU/L), and (c) total bilirubin (µmol/L) at baseline (day + 1) and on days + 7(± 3 days), + 14(± 3 days), + 28(± 3 days), + 42(± 3 days), and + 84(± 3 days) of isavuconazole administration presented in box plots, for patients with and without baseline hepatotoxicity, defined as ALT ≥ 70 IU/L. Boxes represent the median and 25th and 75th percentiles, whiskers represent the range of maximum and minimum values within the interquartile range. Outliers are not shown. P-values are presented only for statistically significant differences. The X-axis represents days of isavuconazole administration: baseline (day + 1) and days +7(± 3 days), + 14(± 3 days), + 28(± 3 days), + 42(± 3 days), and + 84(± 3 days)

