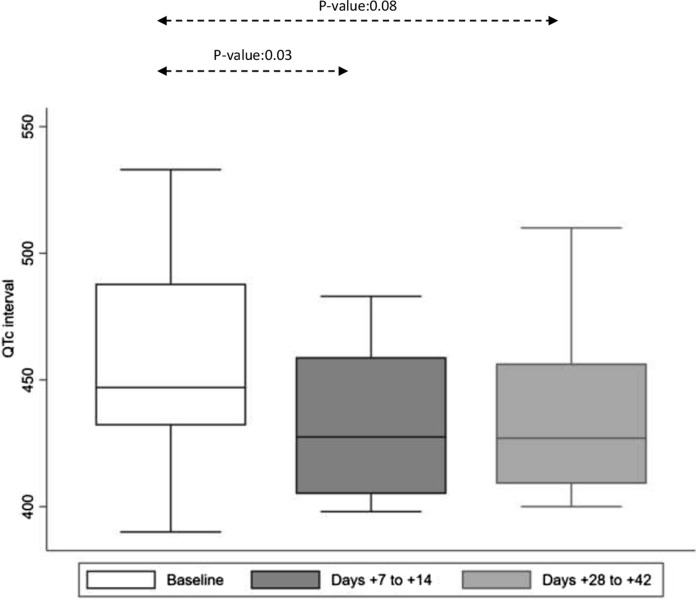
Fig. 3.
Distribution of QTc interval in msec at baseline and during isavuconazole administration presented as box plots. QTc interval measurement was available for 29 patients at baseline. Due to the fact that QTc interval measurements were not available at all time points during the study period, we included QTc between 7 and 14 (14 patients) and 28–42 days (12 patients) of isavuconazole administration. There was a significant decrease in QTc interval from baseline to days 7–14 and a trend for shorter QTc interval between days 28–42 of isavuconazole administration. Boxes represent the median and 25th and 75th percentiles; whiskers represent the range of maximum and minimum values within the interquartile range

