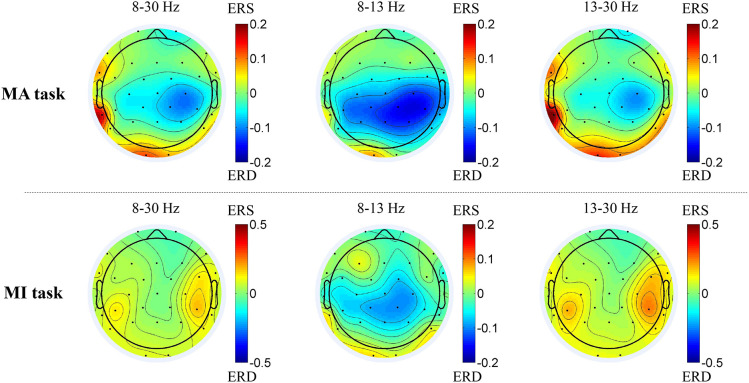
FIGURE 3.
Average topographies of all 14 patients in the 8–30 Hz, 8–13 Hz and 13–30 Hz frequency bands between the MA and MI tasks. The first row shows the average topographies of the 8–13 Hz and 13–30 Hz bands in the MA tasks. The second shows the average topographies of the 8–30 Hz, 8–13 Hz and 13–30 Hz bands in the MI tasks.

