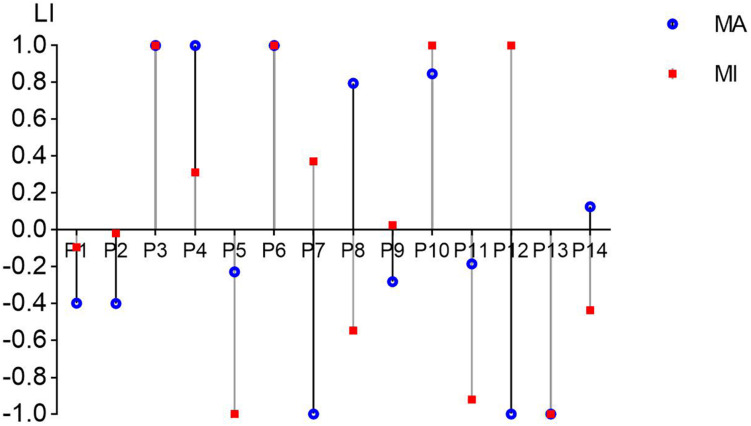
FIGURE 5.
The laterality index (LI) values from C3/C4 channels in all 14 patients in the MA and MI tasks in the 8–30 Hz band. The value range of LI can be from –1 (entirely ipsilesional) to 1 (entirely contralesional). The blue round dots present the LI values of the MA task and the red square dots present the LI values of the MI task.

