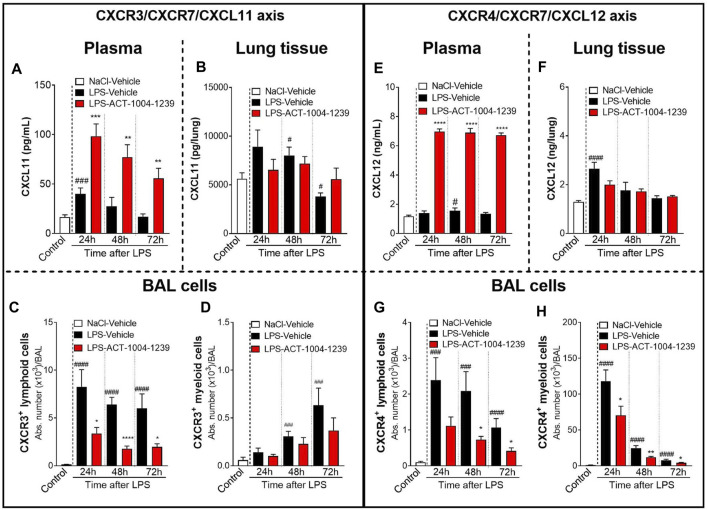
FIGURE 3.
Antagonism of CXCR7 increases plasma CXCL11 and CXCL12 levels and decreases CXCR3+ and CXCR4+ BAL infiltrates post LPS challenge. ALI was induced by nebulized LPS inhalation, and DBA/1 mice were treated with vehicle (LPS-vehicle, black bars) or ACT-1004-1239 (LPS-ACT-1004-1239, 100 mg/kg, red bars) orally, twice daily, 1 h prior to LPS challenge. Control mice received vehicle 1 h prior to NaCl 0.9% inhalation (NaCl-vehicle, white bars; n = 12 mice, pool of all time points). Protein concentrations of CXCL11 and CXCL12 in the plasma and lung tissue and BAL flow cytometry of immune infiltrates were performed 24, 48, and 72 h after challenge (n = 6–8 mice per time point). Time course of CXCL11 protein concentration in the plasma (A) and lung tissue (B). Chemokine concentrations are expressed in pg/ml (plasma) or pg/lung homogenate (mean ± SEM). **p < 0.01, ***p < 0.001 versus LPS-vehicle-treated animals or # p < 0.05, ### p < 0.001 versus NaCl-vehicle-treated control mice using Student t-tests. Time course of BAL CXCR3+ lymphoid (C) and myeloid (D) infiltrates. Results are expressed as absolute cell counts in the BAL (mean ± SEM). *p < 0.05, ****p < 0.0001 versus LPS-vehicle-treated animals or ### p < 0.001, #### p < 0.0001 versus NaCl-vehicle-treated control mice using Student t-tests. Time course of CXCL12 concentration in the plasma (E) and lung tissue (F). Chemokine concentrations are expressed in ng/ml (plasma) or ng/lung homogenate (mean ± SEM). ****p < 0.0001 versus LPS-vehicle-treated animals or # p < 0.05, ### p < 0.001 versus NaCl-vehicle-treated control mice using Student t-tests. Time course of BAL CXCR4+ lymphoid (G) and BAL CXCR4+ myeloid (H) infiltrates. Results are expressed as absolute counts in the BAL (mean ± SEM). *p < 0.05, **p < 0.01, using Student t-test versus LPS-vehicle-treated animals or ### p < 0.001, #### p < 0.0001 versus NaCl-vehicle-treated control mice using Student t-tests.

