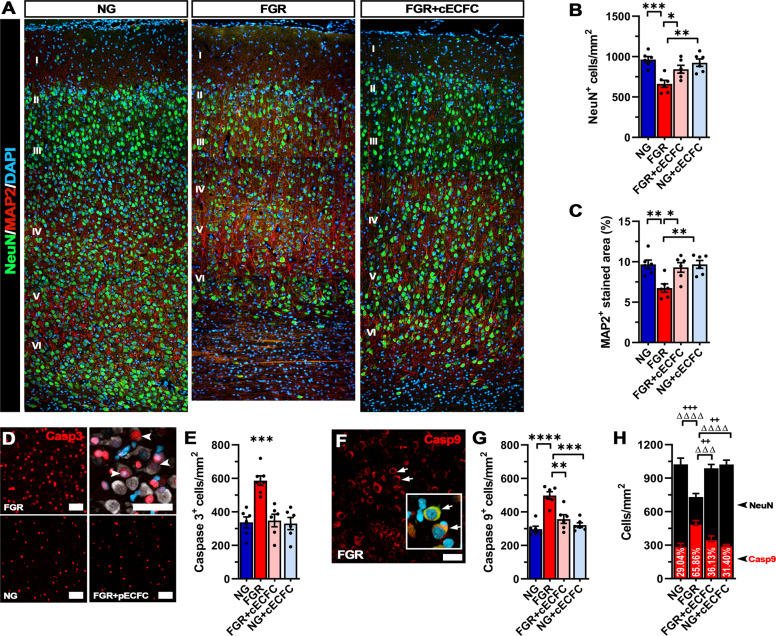
Fig. 6. Neuronal integrity is recovered in FGR cortex following cECFC treatment.
A Representative labelling of neurons in the cortex at day 4. NG demonstrates dense labelling of mature neurons (NeuN; green) and microtubule-associated protein 2 (MAP2; red). FGR demonstrates altered labelling for both NeuN (green) and MAP2 (red). Neuronal labelling is sparse and MAP2 labelling showed weaker perikarya and dendritic labelling compared with other groups. These observations were evident across most cortical layers (II-VI). B Quantification of labelling demonstrated decreased numbers of NeuN-positive cells in FGR cortex which was not observed in FGR + cECFC brain. C MAP2 quantification also demonstrated a similar trend with FGR + cECFC displaying values similar to NG cortex. D FGR cortex demonstrated high numbers of casp3-positive cells, with limited co-localisation to mature neurons (NeuN; grey). E FGR displayed elevated cleaved-casp3-positive cells relative to all other groups. F Labelling for the initiator caspase (Caspase 9; red) showed clear localisation in mature neurons (see insert: co-localisation with NeuN indicated with arrows). G Quantification of casp9-positive cells showed an increase in FGR relative to all other groups. H Co-localisation analysis of casp9+/NeuN+ cells demonstrated significantly increased proportion of neurons undergoing initiation of apoptosis in FGR cortex relative to all other groups (+ denotes significance between neuronal counts, Δ significance between casp9 counts). All values are expressed as mean ± SEM (minimum n = 6 for all groups). Two-way ANOVA with Tukey post-hoc test (*p < 0.05, **p < 0.01, ***p < 0.001, ****p < 0.0001) (Scale bars: 50 µm).

