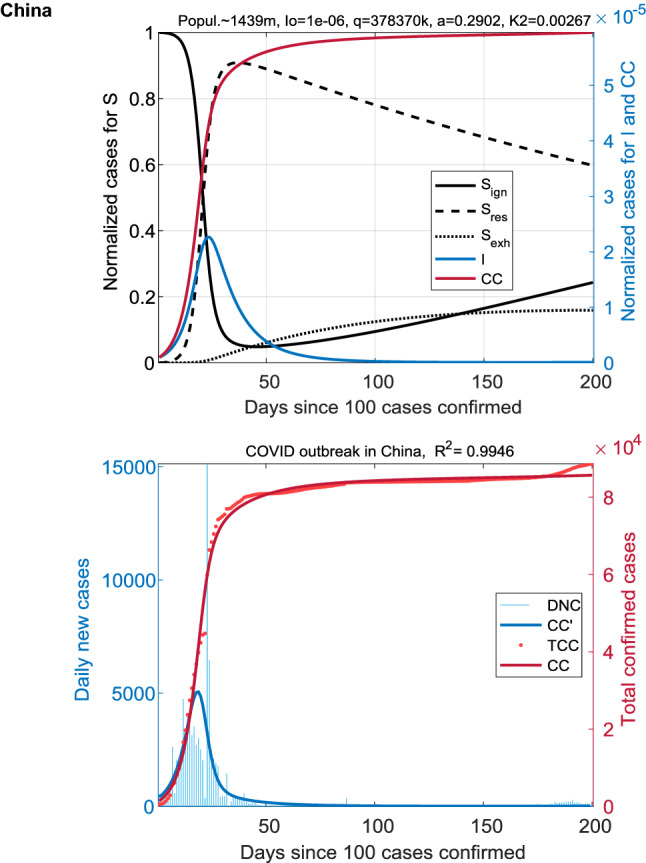
Figure 1.

Coronavirus outbreak in China. The dynamics of the SIRSS model is shown in the top panel: Sign, Sres, Sexh, I, and CC = I + R. Fitted COVID data in absolute values (total confirmed and daily new cases: TCC and DNC) are displayed at the bottom. The beginning of the infection spread is characterized by a single wave, followed by a plateau on CC(t). Fractions Sign and Sres quickly interchange with an increase in I(t), and Sexh gradually increases to a relatively low level of ~ 15%.
