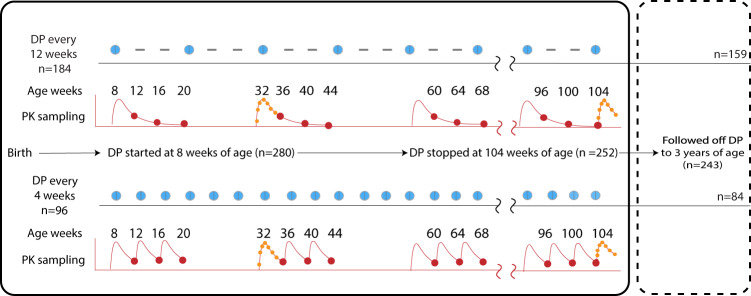
Fig. 1. Summary of trial interventions and sampling for piperaquine concentrations.
Blue dots indicate dihydroartemisinin-piperaquine (DP) courses dispensed, and dashes indicate episodes when a placebo was given. The red dots indicate sparse pharmacokinetic (PK) sampling for piperaquine concentrations (all participants contributed data) and red lines indicate typical pharmacokinetic profiles. Intensive sampling, in orange dots, occurred at 32 and 104 weeks (22 individuals in every 12 weeks and 10 in the every 4 weeks arm).

