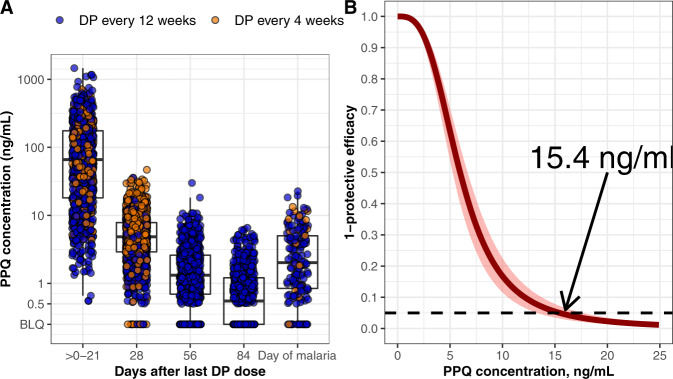
Fig. 5. Relationship between piperaquine (PPQ) concentration and protective efficacy.
A Measured PPQ concentrations by days after dihydroartemisinin-piperaquine (DP) and at time of malaria diagnosis (n = 280 children). Points indicate observed data, boxes indicate PPQ levels for 25% (minima), 50% (center), and 75% (maxima) of the population, and vertical bars represent PPQ levels for 95% of the population. B Relationship between PPQ concentration and protective efficacy. The solid line indicates the median estimate from the pharmacokinetic/pharmacodynamic model, and the shaded areas the 95% confidence interval. The indicated concentration (15.4 ng/mL) reduced the hazard of incident malaria by 95%.

