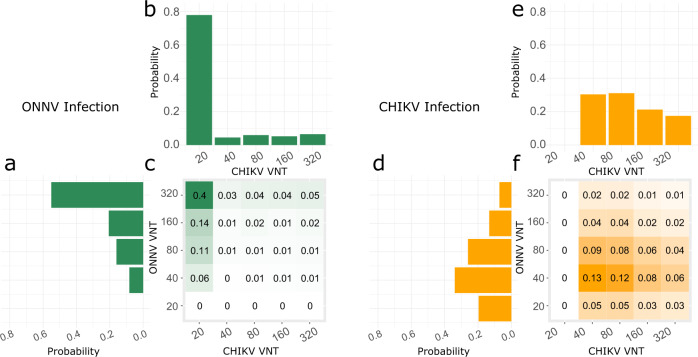
Fig. 2. Response to infection.
The heatmaps represent the model estimates of the probability distribution of CHIKV and ONNV neutralization titers (VNT) following an ONNV (a–c, green) and a CHIKV infection (d–f, orange). They are the frequencies we would expect from samples obtained in a context where a single pathogen circulated. The histograms are the sum along rows and columns and display the probability distribution of ONNV response (a, d) and CHIKV response (b, e).

