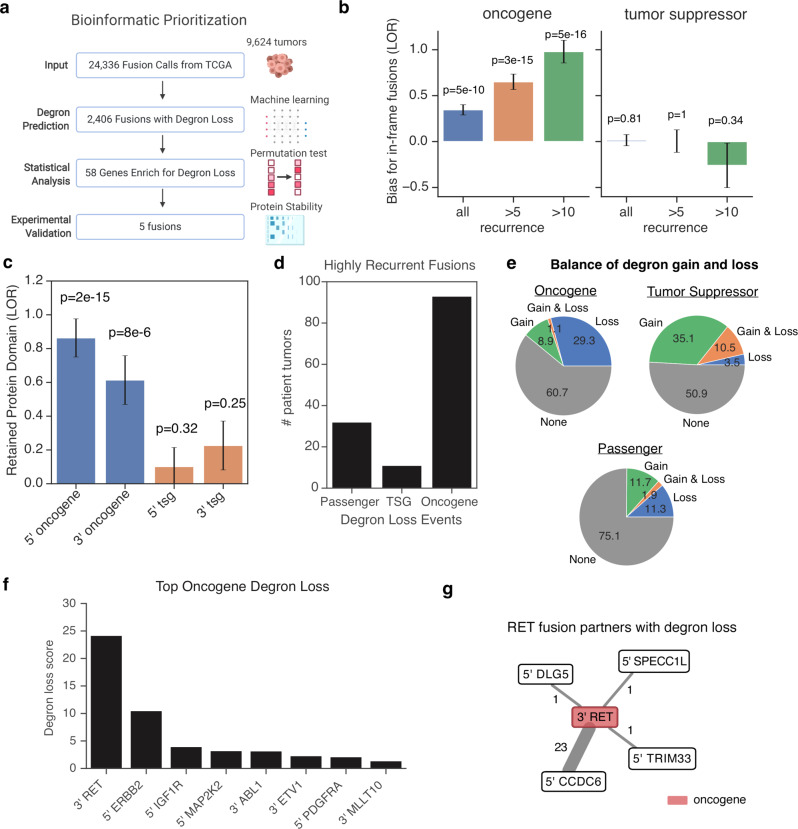
Fig. 2. Degron landscape of genetic fusions in cancer.
a Combined analysis pipeline for validating cases of degron loss in fusion genes. Created with BioRender.com. b Enrichment for in-frame gene fusions for oncogenes and tumor suppressor genes relative to likely passenger genes (STAR methods). Recurrence is the number of tumors that a fusion gene was present in the TCGA. Barplot displays the log odds ratio (LOR), with error bars indicating ±1 SE. In order of bars from left to right, sample sizes (i.e. number of fusions) are n = 17,848, n = 4254, n = 1316, n = 17,581, n = 3,799, and n = 925. A two-sided Fisher’s exact test was performed. c Enrichment analysis for whether gene fusions result in the retention of at least one protein domain from the original protein sequence. Barplot displays the log odds ratio (LOR), with error bars indicating ±1 SE. In order of bars from left to right, sample sizes (i.e. number of fusions) are n = 8911, n = 9139, n = 8935, and n = 8896. A two-sided Fisher’s exact test was performed. d The total number of tumors in the TCGA that contain highly recurrent fusion genes (a fusion found in >10 tumors). e Balance of degron gain and loss in oncogene, tumor suppressor genes or passenger genes. f The top 10 most significant oncogenes that are biased towards loss of internal degrons in gene fusions. g Network diagram showing degron loss in the fusion partners to oncogene RET. Line width represents the frequency of the event. Red indicates previously annotated oncogenes. Numbers indicate the recurrence of the fusion across TCGA. The relevant raw data are provided in Source Data.

