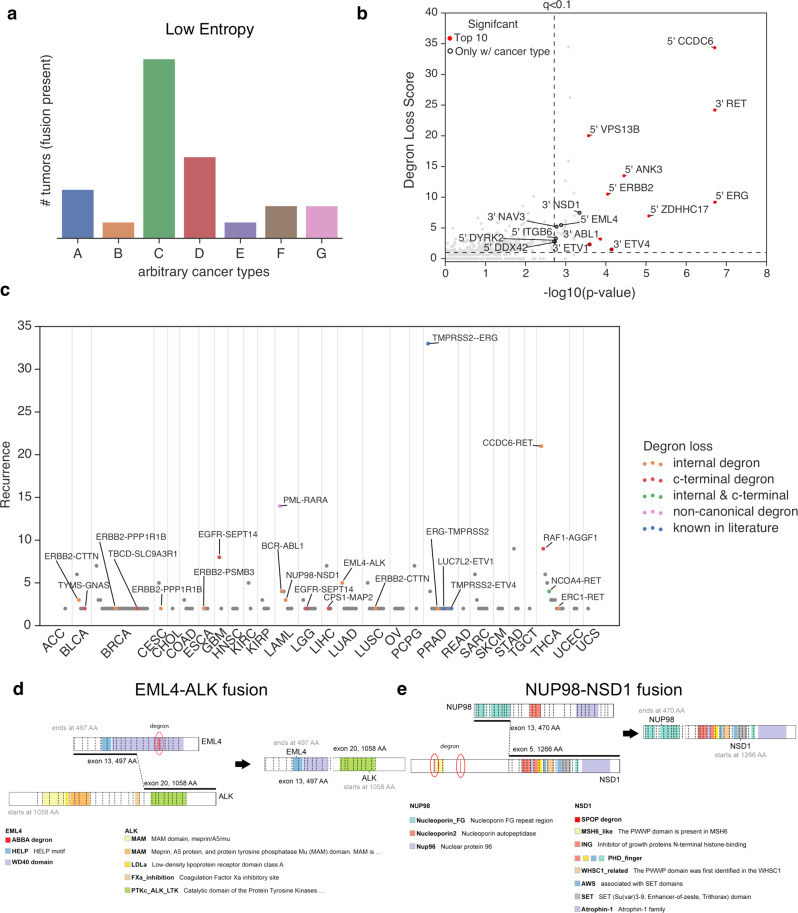
Fig. 3. Cancer type-specificity of genetic fusions reveals oncogenicity.
a Conceptual diagram showing that a low entropy value that summarizes the distribution of a fusion across cancer types indicates the fusion gene is cancer type-specific. b Scatter plot showing the statistical significance of gene fusions for loss of internal degrons when also considering information on cancer type-specificity. X-axis represents the combined p value for both degron loss and cancer type-specificity (Fisher’s method), while the Y-axis represents the effect size for degron loss. P values were calculated using a one-sided permutation test. See “Methods” for additional details on calculation of p values. c Scatter plot indicating the most recurrent fusion genes for particular cancer types. Fusion genes with degron loss are labeled in color, including internal degrons, C-terminal degrons, and those degrons previously known in the literature. d A schematic diagram showing the fusion of EML4 and ALK genes in lung adenocarcinoma. e A schematic diagram showing the fusion of NUP98 and NSD1 genes in lung adenocarcinoma. The relevant raw data are provided in Source Data.

