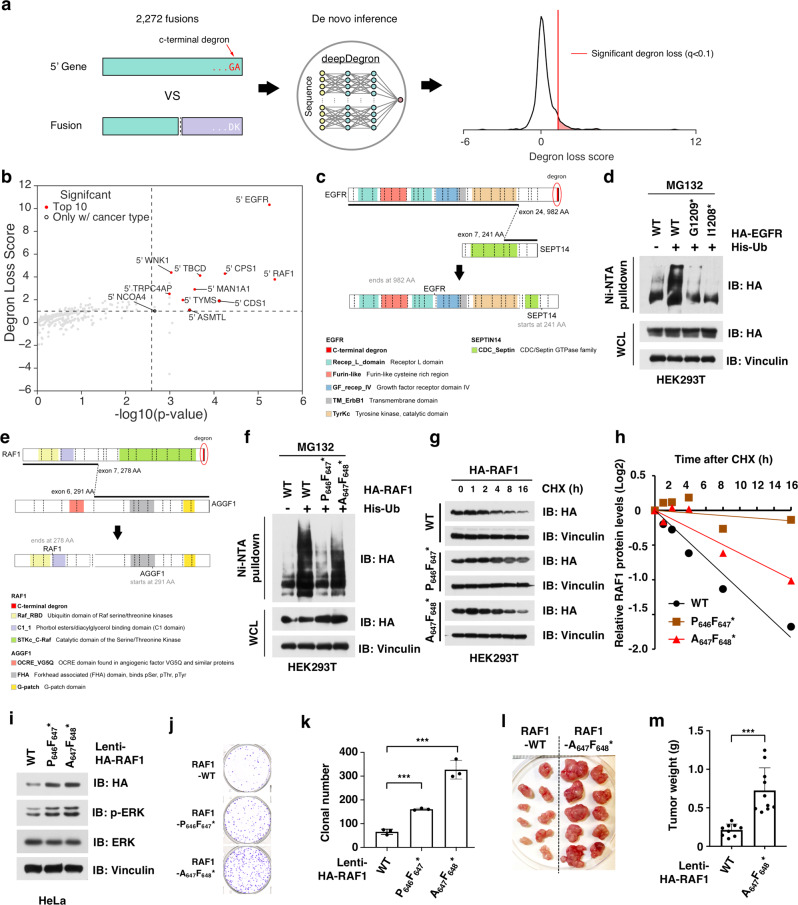
Fig. 6. Systematic analysis of C-terminal degron loss.
a Conceptual diagram showing that fusions resulting in C-terminal degron loss were identified by the deepDegron method. b Top fusions enriched for C-terminal degron loss. X-axis represents the combined p value for both degron loss and cancer type-specificity (Fisher’s method), while the Y-axis represents the effect size for degron loss. P values were calculated using a one-sided permutation test. See “Methods” for additional details on calculation of p values. c Diagram of an EGFR-SEPT14 fusion leading to loss of the C-terminal -GA* degron. d Removal of C-terminal degron (-GA*) lead to less ubiquitination of EGFR. WT and mutant HA-tagged EGFR proteins were expressed with His-Ub in HEK293T cells and treated with 10 μM MG132 for 12 h. Cells were lysed under denaturing conditions and His-Ub-conjugated proteins were pulled down with Ni-NTA-resin, washed, and immunoblotted for indicated proteins. e Diagram of an RAF1-AGGF1 fusion leading to loss of the C-terminal -Vx* degron. f Removal of C-terminal degron (-Vx*) lead to less ubiquitination of RAF1. WT and mutant HA-RAF1 were expressed with His-Ub in HEK293T cells and subsequently treated and pulled down as described in d. g, h Removal of C-terminal led to extended protein half-life of RAF1 in cycloheximide (CHX) assay. WT and mutant HA-RAF1 proteins were expressed in HEK293T cells and treated with CHX for indicated time. Cells were harvested, lysed, and immunoblotted for indicated proteins (g) and quantification (h). i Immunoblot analysis for HeLa stable cell lines that express either WT RAF1 or RAF1 mutants without -Vx* degron. j, k The stable cells expressing the RAF1 mutants without -Vx* degron had greater clonogenicity than WT RAF1-expressing cells in vitro. The stable cell lines as in Fig. 6i were subjected for colony formation assay (j) and statistical analysis (k). n = 3/group. Two independent experiments were performed. l, m RAF1 mutant-expressing cells developed larger tumors than WT RAF1-expressing cells in vivo. The stable cell lines as in i were subjected for mouse xenograft assay (l) and statistical analysis (m). n = 9 mice for the RAF1-WT group and n = 10 mice for the RAF1-mutant group. Data are presented as mean ± SD. ***p < 0.01; by two-tailed Student’s t-test. Two independent experiments were performed for d, f, and g. The relevant raw data and uncropped blots are provided in Source Data.

