Fig. 1.
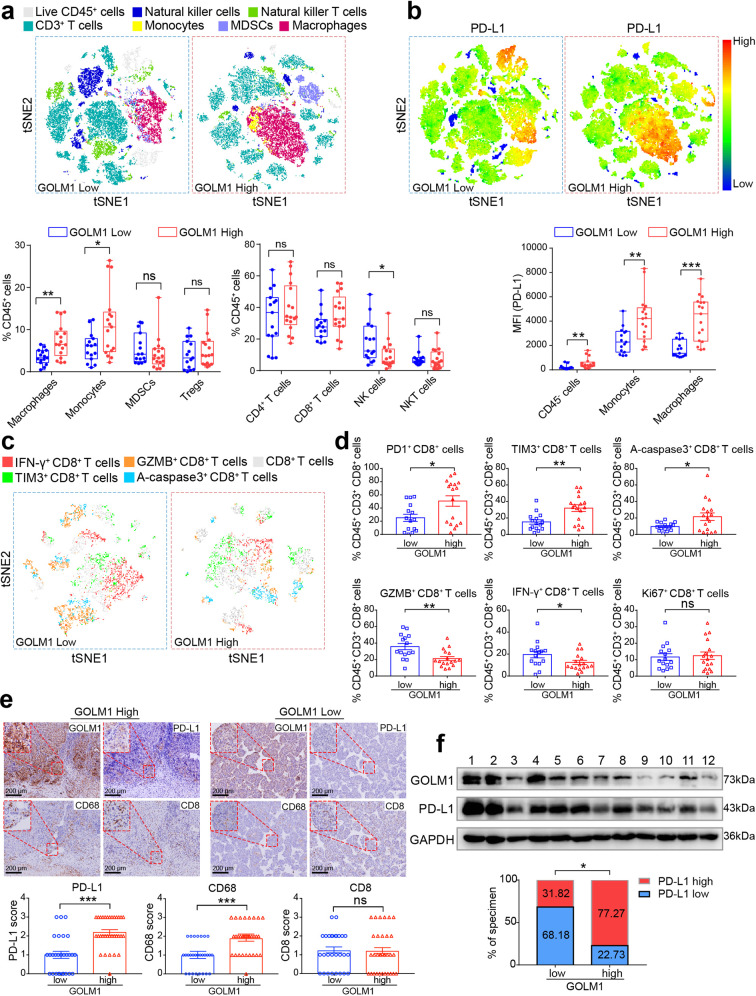
Overexpression of GOLM1 is associated with the immunosuppressive microenvironment in HCC and immune-escape of tumor cells. a Differences in the immunophenotypes of infiltrating immune cells detected by flow cytometry in HCC tissues with high or low GOLM1 expression. t-Distributed Stochastic Neighbor Embedding (tSNE) map derived from flow cytometric analysis indicated the populations of the infiltrating immune cells, including CD3+ T cells (CD45+CD3+), natural killer (NK) cells (CD45+CD3−CD56+), natural killer T (NKT) cells (CD45+CD3+CD56+), monocytes (CD45+CD14+), macrophages (CD45+CD14+CD68+), and myeloid-derived suppressor cells (MDSC) (CD45+CD11b+CD33+). Percentages of immune cell populations within CD45+ cells are shown on the bottom panel (n = 32). b PD-L1 expression profiles detected by flow cytometry in HCC tissues with high or low GOLM1 expression. tSNE map derived from flow cytometric analysis indicated the intensity of PD-L1 expression in CD45+ cells. Mean fluorescence intensity (MFI) of PD-L1 staining in tumor and stromal cells (CD45−), monocytes (CD45+CD14+), macrophages (CD45+CD14+CD68+) is shown on the bottom panel (n = 32). c Representative tSNE map derived from flow cytometric analysis of CD8+ T cells in HCC tissues with high or low GOLM1 expression. d The functional state of CD8+ T cells was analyzed by flow cytometric quantification of GZMB+, IFN-γ+, PD-1+, TIM3+, Ki67+, and active-caspase3+ cells in HCC tissues with high or low GOLM1 expression (n = 32). e The differences of CD68 (macrophages), CD8 (CD8+ T cells), and PD-L1 levels detected by immunohistochemical staining (IHC) in human HCC tissues with high or low GOLM1. Representative IHC images for GOLM1, CD68, PD-L1, and CD8 expression in HCC tissues with high or low GOLM1 expression (n = 60) are shown on the top panel. The statistical analysis of IHC score is shown on the bottom panel. f The levels of GOLM1 and PD-L1 were detected by Western blot in HCC tissues and normalized against those of GAPDH using a computerized image system (Image-Pro Plus 6.0). Intensity higher than the median level was defined as high expression. The statistical analysis of quantification is shown on the bottom panel (n = 44). *P < 0.05, **P < 0.01, ***P < 0.001, ns: no significant

