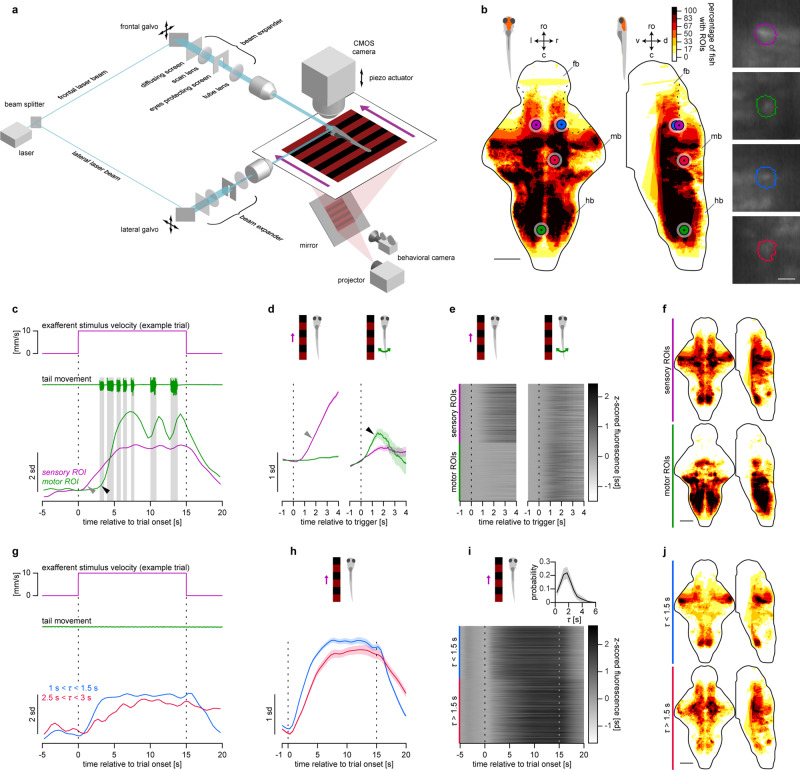
Fig. 3. Larval zebrafish are able to integrate the optic flow.
a Light-sheet microscope combined with a behavioral rig used in the whole-brain functional imaging experiments. b Spatial distribution of detected ROIs from six larvae. Color indicates percentage of larvae with ROIs in the corresponding voxel of the reference brain. b, f, j Maximum dorsoventral or lateral projections are shown: ro rostral direction, l left, r right, c caudal, d dorsal, v ventral; fb forebrain, mb midbrain, hb hindbrain (see Supplementary Fig. 2 for anatomical reference); scale bars: 100 µm. Dotted black curves outline the dorsal rostrolateral midbrain that was blocked from the scanning laser by the eye-protecting screens. Colored circles indicate location of example ROIs shown in the figure, images on the right show their shape (scale bar: 10 µm). c Z-scored fluorescence of sensory and motor example ROIs in one trial. b–f Magenta and green colors represent sensory and motor ROIs, respectively. Vertical shaded bars indicate bouts. Gray triangle indicates the response of the sensory ROI to the grating motion, black triangle indicates the response of the motor ROI after the first bout onset. d Average grating-triggered and bout-triggered fluorescence of example ROIs presented in c. d, h Shaded areas represent SEM across triggers. e Average grating-triggered and bout-triggered fluorescence of all sensory and motor ROIs pooled from all imaged larvae. f Spatial distribution of sensory and motor ROIs. f, j color indicates percentage of larvae with ROIs from respective functional group in the corresponding voxel of the reference brain, color map is the same as in b. g Z-scored fluorescence of two sensory ROIs in one trial: one with short integration time constant and one with long. b, g–j Blue and red colors represent sensory ROIs with short and long time constants, respectively. h Average grating-triggered fluorescence of example ROIs presented in g. i Average grating-triggered fluorescence of all sensory ROIs. Inset shows distribution of time constants of sensory ROIs (mean ± SEM across larvae). j Spatial distribution of all sensory ROIs with short and long time constants.

